Testimony: A Closer Look at This Year’s Rent Guidelines Board Data
Samuel SteinOksana Mironova
Thank you for the opportunity to testify before the Rent Guidelines Board as you conduct your annual deliberations on an appropriate rental adjustment. The decisions this board makes impacts millions of New Yorkers, many of whom are struggling to remain in their homes. We appreciate the chance to share with the board our perspective on the data that the RGB staff has presented so far, and the chance to add data of our own. We welcome the board’s new chair, Nestor Davidson, as well as all the new Board members.
Our names are Samuel Stein and Oksana Mironova, and we are senior housing policy analysts at the Community Service Society of New York (CSS). CSS is an independent nonprofit organization that addresses some of the most urgent problems facing low-income New Yorkers, including the effects of the city’s chronic housing crisis. Since 2002, we have administered our annual Unheard Third survey, the longest running scientific survey of low-income communities in the United States.
A Closer Look at This Year’s RGB Data
As policy researchers tasked with collecting and interpreting publicly available data, we recognize the difficult task the Rent Guidelines Board staff has in compiling the reports they present to the Board. The staff has to deal with contradictions in data reporting timelines, varieties in scale and scope, questions of self-reported reliability, and more. Typically, one single data point the staff generates – the highest of the commensurate rent guidelines – gets picked up by the press as if it were the staff or the Board’s recommended rent increases, which clearly it is not. (We appreciated the caveat the staff added to the data this year, though unfortunately much of the reporting that followed didn’t heed it.) A broader look at the data the RGB staff has presented to the Board so far this year paints a very different picture than that one number conveys.
In the Income and Expense Study, we learned the following about conditions for landlords in 2021, the most recent year Real Property Income and Expense (RPIE) statements were available
- Losses in Net Operating Income (NOI) were concentrated in what the Board calls “core Manhattan.” NOI losses in “core Manhattan” were more than four times higher than the rest of the city. Some neighborhoods in Queens, Brooklyn and Staten Island saw NOI growth, in stark contrast to the 21 percent losses in “core Manhattan.” Similarly, the preponderance of distressed buildings were located in "core Manhattan” – not an area that has recently undergone many real estate losses. Building owners’ incomes grew in every borough but Manhattan.
- Between 2020 and 2021, rent collection mostly rose, but went down 5 percent in Manhattan, and was most pronounced in newer buildings. Every Community District in the Bronx saw rent collections rise, while just one in Manhattan – Central Harlem – saw the same. The greatest declines in rent collection were in two of the most expensive rental markets in the city: the Financial District and the Upper East Side. This is almost certainly due to temporary high-income flight from the city during this specific time. The 2021 Housing and Vacancy Survey (HVS) offers data to support this trend: in 2021, vacancy was far higher in Manhattan (10 percent) than the rest of the city (4.54), and apartments renting for more than $2,300 per month were vacant at a rate of nearly 13 percent.
- NOI losses clearly correlated with the percentage of rent stabilized apartments in a building, with the highest losses in buildings with the least stabilized apartments. The only exception to this trend was that some newer, likely 421-a buildings in Manhattan suffered similar setbacks, perhaps suggesting that high rent-paying tenants in such buildings also left the city, behaving more like other high-rent paying market-rate renters than most long-term rent stabilized tenants. HCR reported positive rent growth for the year, as did the RGB’s own Rent Index. Only the RPIE showed rental decline, suggesting it was the mix of market-rate units that was responsible.
- Even with NOI losses, the report showed that NOI is up by about 50 percent since 1990, accounting for inflation. While we often think of Manhattan buildings as being the most profitable because they are the most expensive, in fact the greatest growth was outside Manhattan, where rent gaps were wider. Queens saw NOI growth of 76 percent. For the Bronx, the city’s poorest and lowest-rent borough, the growth was 81 percent. Brooklyn saw astronomical NOI growth of 171 percent.
If we put this all together, a clear picture emerges: during what we hope were the worst years of the COVID-19 pandemic, relatively high-income tenants in market rate apartments in “core Manhattan” – and, to a lesser extent, tenants in generally expensive apartments that are stabilized because of 421-a – left the city in large numbers, creating vacancy losses for owners of buildings with mixed market-rate and rent stabilized apartments. Retail income also declined for this same subset of mostly “core Manhattan” buildings.
2021 was the most recent RPIE data the board had available. But does anyone here believe that those market-rate and 421-a apartments remained vacant over the past two years? Or does anyone think that the first-time concessions landlords may have offered new tenants have remained upon lease renewal? Of course not. In the years since, market-rate rents have shot up, especially in the very neighborhoods that showed the greatest NOI losses in 2021.
Let’s consider some data from StreetEasy on changes in the market since the 2021 RPIE data presented to the board. Median Manhattan asking rents in January 2021 were $2,760, which, accounting for inflation, was the lowest point in 10 years of StreetEasy data – a 26 percent decline from January 2020. By January 2022, however, Manhattan median asking rents had shot up 34 percent to $3,700, or back to pre-pandemic levels. By January 2023, they were up another 20 percent to an astronomical $4,200. Taken together, median asking rents in Manhattan went up 52 percent since 2021. At the same time, vacancy rates went back down. Manhattan vacancies in August 2020 were 95 percent higher than they were the previous year, but by August 2022 they were 20 percent lower than August 2019. We have focused here on Manhattan because that is where most of the NOI losses were concentrated, but asking rents have gone up and vacancies have gone down in pretty much every borough. (Vacancy didn’t go down in the Bronx, but it never went up there – a testament to the fact that lower income rent stabilized tenants did not often leave during the pandemic.)
Even the Manhattan retail sector since started to recover, offering an important source of non-residential income for many rent-stabilized buildings, particularly in “core Manhattan,” which has the highest share of mixed-use buildings with rent stabilized housing. Two weeks ago, in an article titled “Manhattan Retail Remains on the Upswing,” The Real Deal reported on CBRE data showing that for the past seven months, leasing has been up in the 16 Manhattan retail corridors they track.
Data presented in the Rent Guidelines Board’s Mortgage Survey Report suggests the market understands that we are in a different place now than we were in 2021. In that report, we find:
- Rent stabilized sale volume went up 14 percent from the previous year. Landlords are not selling for a loss; the average sale price per unit rose $23,248 in real terms (or $47,022 in nominal terms) over last year, and is now higher than it was in 2016, 2017, or 2018. To paraphrase Mark Twain, the reports of the rent stabilized housing market’s death after 2019 have been greatly exaggerated.
- There were no foreclosures of buildings with rent stabilized apartments in the survey sample, and 99.5 percent of portfolios were performing.
Buyers, apparently, are fairly convinced that buildings with rent stabilized apartments – without the possibility to massively raise rents and ultimately deregulate them – remain a smart investment. While rising interest rates may frustrate landlords’ attempts to pull equity from rent stabilized buildings through cash-out refinancing, they are still finding buyers willing to pay top dollar for their buildings. At the end of the day, landlords have a tremendously valuable asset on their hands; tenants have no such economic advantage.
Landlords will certainly argue that rising interest rates make lending terms less favorable to them and will use that to argue that the Board should significantly raise rents. Let us briefly examine the logic of this argument. Why did interest rates go up? The Federal Reserve rose interest rates in order to curb inflation, which is eating into landlords’ and tenants’ budgets alike. If the Rent Guidelines Board uses rising interest rates as a reason to inflate rents for over two million New Yorkers – the single greatest cost in most household budgets – it would directly counter the Fed’s stated policy purpose. Raising prices is no way to combat inflation.
The data on renters from this year’s Income and Affordability Study underlines why tenants cannot afford higher rents.
- Most tenants are rent burdened in New York City, paying more than 30 percent of their income in rent. The proportion of rent burdened households rose by four percentage points between 2019 and 2021. These figures are higher for rent stabilized tenants than market-rate tenants, with nearly 40 percent of rent stabilized households paying a majority of their income in rent, and 35 percent of rent stabilized tenants paying more than 30 percent of their income in rent.
- The Consumer Price Index rose 6.1 percent in the New York City Metropolitan area, the largest increase since 1981. Of course, landlords are also affected by CPI growth, but they are not the only ones who pay for housing goods and services. Tenants are usually responsible for electricity, cooking gas and internet in their apartments, and these prices all went up in the past year. Electricity costs, for example, rose 12.5 percent during 2022, and are expected to rise another 5.7 percent this year. Gas bills went up 5 percent, and are expected to rise another 4.6 percent this year.
- All growth in wages was swallowed by inflation, for all practical purposes resulting in wage declines. Real wages declined by 2.1 percent in 2022. It is worth recalling here that the number one driver of inflation for New Yorkers is rent. Last month the Bureau of Labor Statistics reported that housing costs are responsible for more than 70 percent of contemporary inflation.
- While we are glad to see unemployment decline as a whole in the past year, we are distressed to see that unemployment insurance claims are still well above pre-pandemic levels. Also, it is notable that positive news on the unemployment front only shows up in the 2022 data; in 2021, the year where most of the landlord’s Income and Expense data derives, unemployment was at 10 percent.
- The RGB projects that the Emergency Rental Assistance Program (ERAP) will pay out $2.361 billion to New York City landlords for past – and in some cases prospective – missed rent. No data was offered on the Landlord Rental Assistance Program, LRAP, but we know from OTDA that this program has paid out $201.75 million to New York City landlords. This combines to a historically large – perhaps unprecedented – amount of public money paid to landlords to recoup their rental shortfalls: $2.563 billion. (For a sense of scale, the entire forecasted capital budget for HPD in 2024 is $1.2 billion, less than half this total.)
This Income and Affordability data – which, it’s worth remembering, is for the most part a year more current than the data about landlord expenses – clearly shows that for tenants, hard times have continued unabated. We will have even more current data to share about that in a moment.
But the data also make clear that the landlord hardships expressed in Income and Expense report’s 2021 data have, to a tremendous degree, since been repaid. Losses due to vacancies have been filled, and with tenants paying far more than they would have a couple years ago. Losses due to nonpayment, meanwhile, have largely been addressed through both the ERAP and LRAP programs, resulting in billions of dollars in public funds addressing landlords’ COVID-related rent shortfalls. There is therefore no need to repay these landlords once again through a rent increase on all rent stabilized tenants.
The Hardships Facing Tenants
Many tenants remain in extremely tenuous economic straits. The Selected Initial Findings of the 2021 Housing and Vacancy Survey (HVS) begin to paint a picture of who lives in rent stabilized housing.
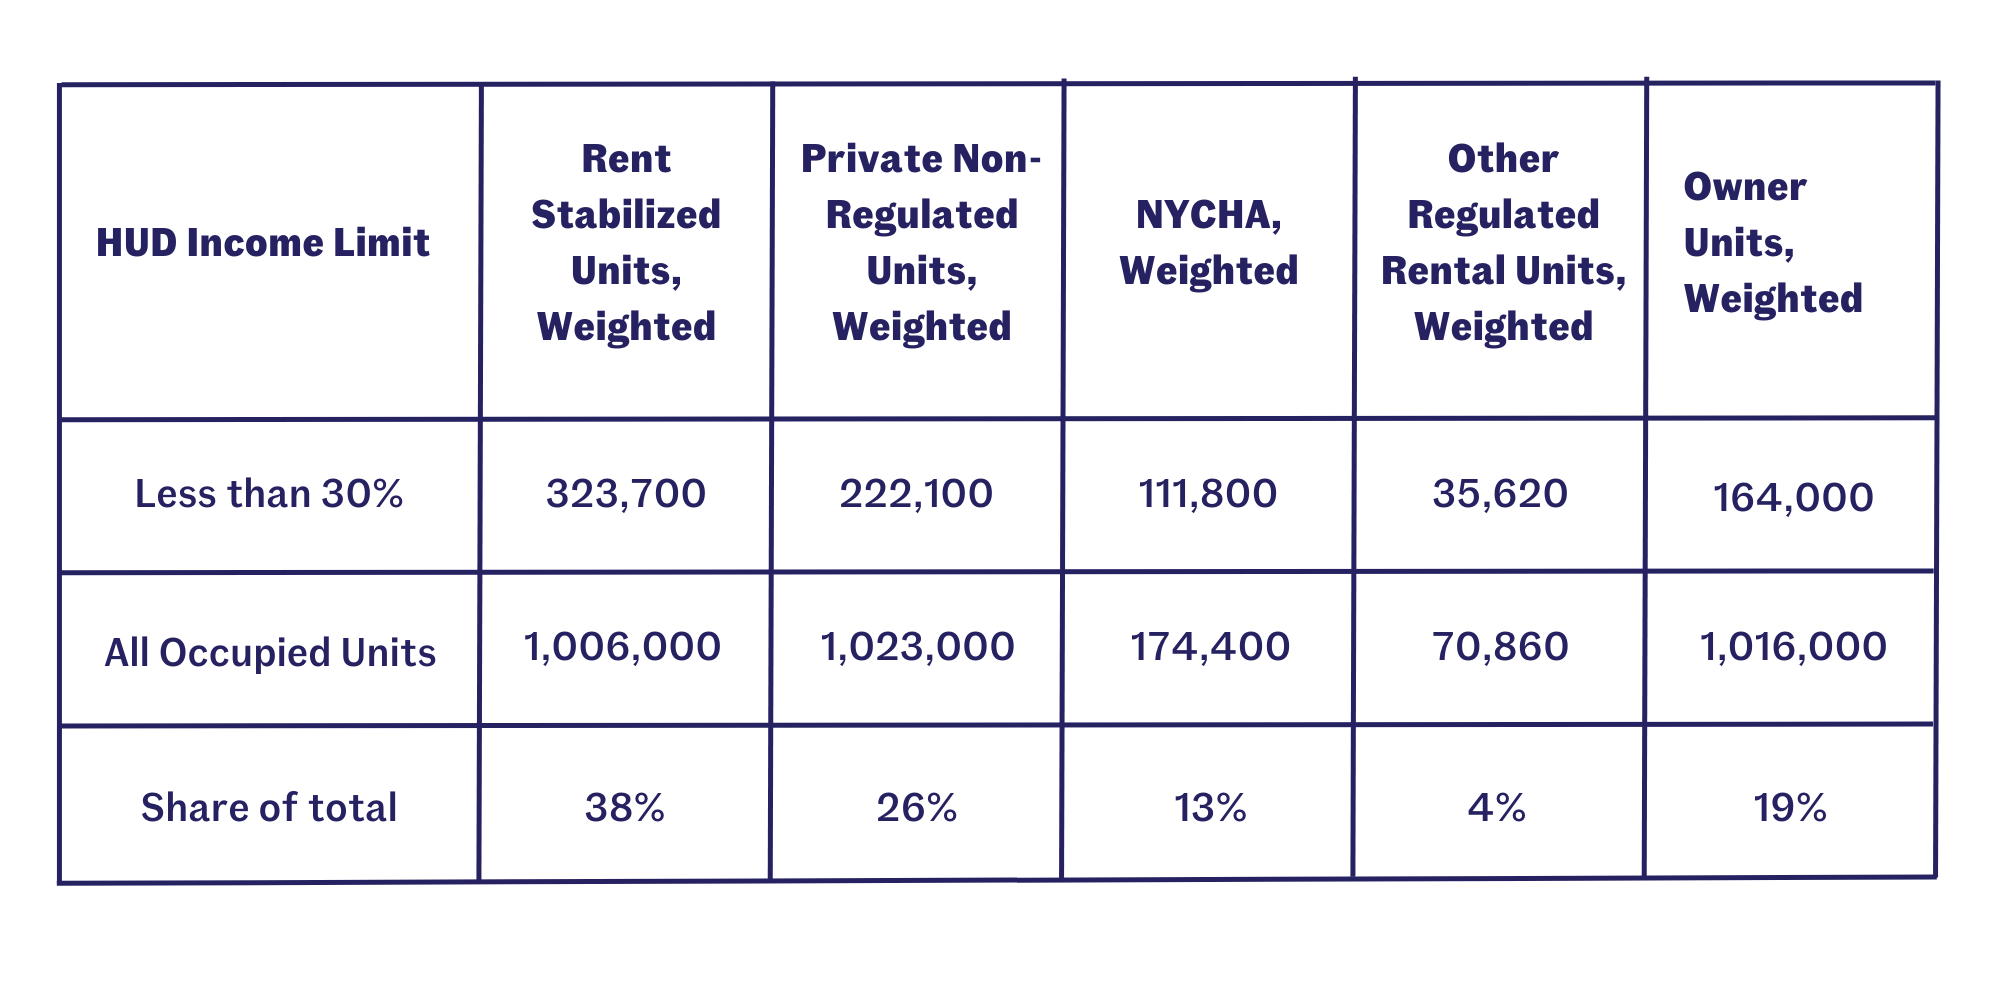
- Even though it is not a means-tested form of housing, rent stabilized apartments are home to the largest number of low-income New Yorkers of any housing type. The following table breaks down by housing type the population of New York City that would qualify for subsidized housing under HUD:[1]

- When compared to market-rate tenants, rent stabilized tenants tend to have lower incomes (a median of $47,000 for rent stabilized tenants, compared to $63,000 for market-rate renters), are more likely to have an elderly householder (31 percent compared to 19 percent), are more likely to have a householder with a disability (22 percent compared to 13 percent), and are more likely to be people of color (68 percent compared to 61 percent).
- When asked their confidence in their ability to pay a $400 emergency expense, just under half of rent stabilized tenants said they could not pay, compared to about a third of market-rate tenants.
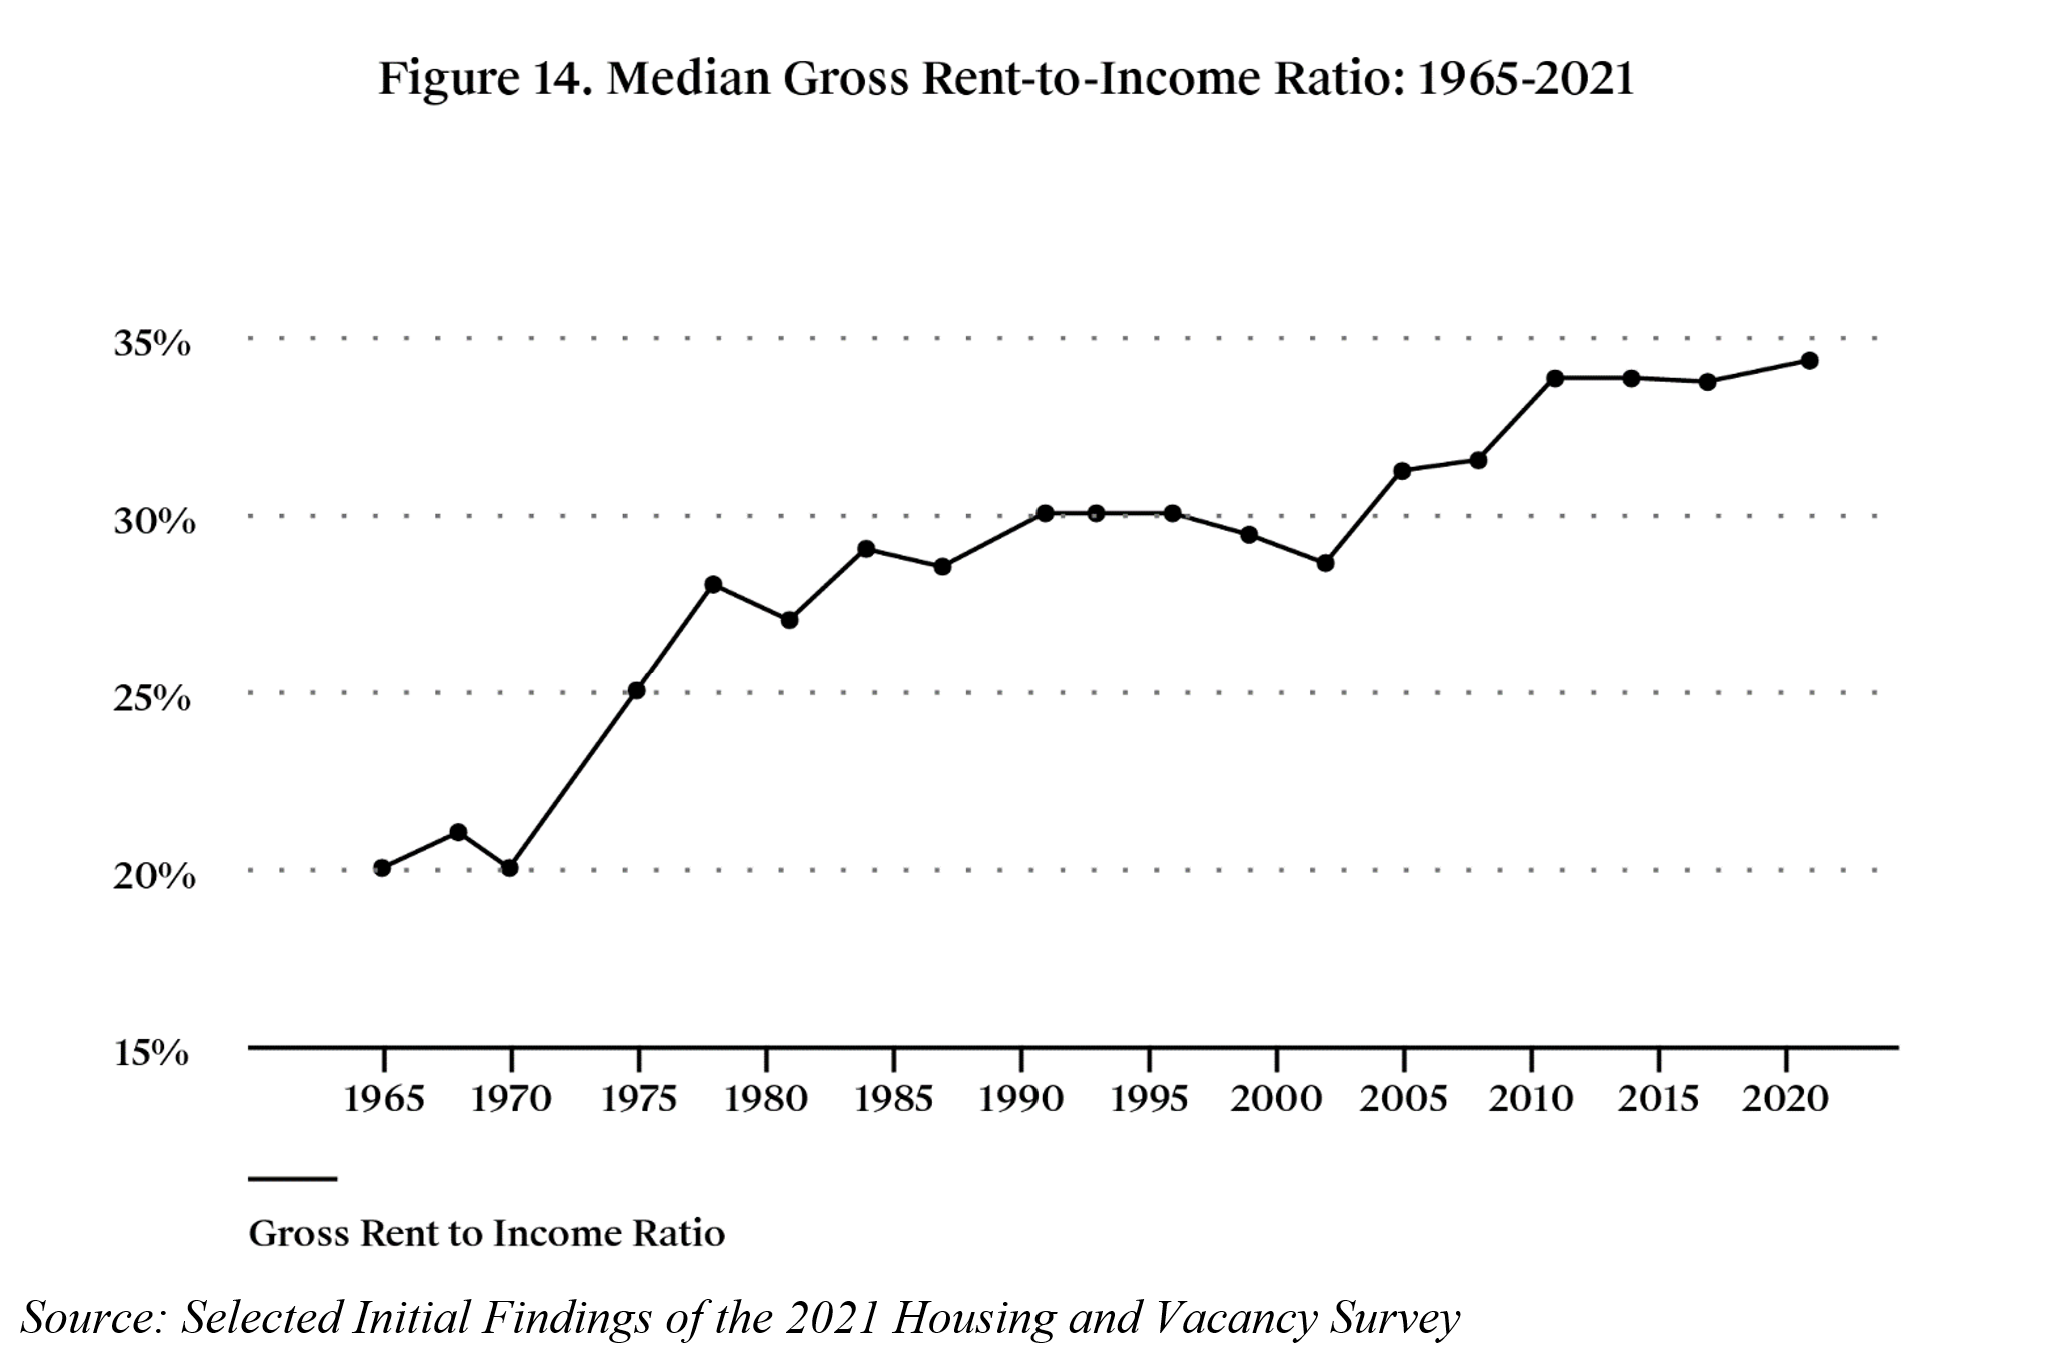
While HVS microdata has not yet been released, the preliminary findings show that tenants are facing historically high rent burdens. The gross rent-to-income ratio has been climbing since 1970, when it was 20 percent, to today’s historic high of nearly 35 percent.
For a more specific look at hardships faced by Rent Stabilized tenants, we offer data from our most recent Unheard Third survey. Each year, CSS contracts a professional polling firm to conduct a statistically rigorous survey of New York City households. The survey was last conducted in August, 2022 – just eight months ago. Here are some of the findings on rent stabilized tenants:
- 48 percent of rent stabilized tenants said being able to afford rent is a problem for them.
- This figure is up from 42 percent last year.
- 31 percent had their work hours, wages, or tips reduced.
- Up from 28 percent last year.
- 20 percent are employed through app-based gig work. Of those, a majority (60 percent) are using gig work to supplement other jobs.
- 14 percent have nothing in savings.
- Down from 23 percent last year.
- 37 percent have $1-$1,000 in savings.
- Up from 31 percent last year.
- 33 percent are on Medicaid.
- Down from 50 percent last year
- 58 percent have credit card debt.
- Up from 47 percent last year.
- 29 percent have student loan debt.
- Up from 21 percent last year.
- 27 percent have medical debt.
- Up from 22 percent last year.
In nearly every case, these findings were more severe than one year prior. (The only exception to this rule is savings: the percentage of rent stabilized tenants with no savings whatsoever went down nine percentage points from last year. The percentage who had saved between $1 and $1,000, however, went up six percentage points. Perhaps this was the result of temporary federal anti-poverty measures, like the child tax credit, which have since expired and not been renewed. An RGB rent increase this year could eat away all of the small savings that some rent stabilized tenants were able to make last year.) The trend of the data clearly points toward rising hardships for rent stabilized tenants.
The Rising Consequences of Rising Rents
With tenants on the edge, an RGB rent increase could push many into nonpayment, eviction, and homelessness. Our Unheard Third data captured the following findings for rent stabilized tenants:
- 39 percent of rent stabilized tenants reported that their income was not enough to meet expenses and bills all or most of the time.
- This finding is up from 35 percent last year.
- 32 percent received food from a food pantry or soup kitchen because they didn’t have enough money to buy food.
- Up from 24 percent last year.
- 23 percent often skipped meals or went hungry because there wasn’t enough money to buy food.
- This figure remained steady from last year.
- 24 percent postponed getting medical care or surgery due to cost.
- Up from 16 percent last year.
- 22 percent were often unable to afford subway or bus fare.
- Up from 21 percent last year.
- 28 percent cut back on buying school supplies or clothes because of lack of money.
- Up from 27 percent last year.
- 14 percent reported that their landlord threatened them with eviction.
- Up from 6 percent last year.
This last finding – the percentage of tenants who reported that their landlord threatened to evict them – was the higher in 2022 than any other year for as long as we have been asking this question (11 years). As the Income and Affordability report noted, evictions are rising sharply so far in 2023, and the proportion of evictions in buildings with rent stabilized apartments rising as well.
Because a member of the Board asked after our testimony last year, I wanted to offer some figures on the CSS Income Support Service division’s work helping tenants avoid eviction. In 2022, CSS offered over $300,000 in grants to 142 families at risk of eviction. While a few of the households were in public housing, the vast majority lived in privately-owned buildings. And of those in private housing, 79 percent were rent stabilized tenants.
We understand that the RGB alone cannot prevent evictions and homelessness. We’re fighting at the City, State and Federal levels for more resources for tenants to pay rent, including reforms to the CityFHEPS program, the creation of a Housing Access Voucher Program, expansion of the federal Section 8 program, and much more. But those bodies have not – yet – acceded to advocate’s calls, leaving hundreds of thousands of low-income rent stabilized tenants without options if the rent rises above what they can afford.
While there are programs that help vulnerable rent stabilized tenants remain in their homes, like SCRIE and DRIE, they are underutilized. According to a NYC Department of Finance report, less than half of the roughly 175,000 households eligible for either SCRIE or DRIE were enrolled in 2017.
We know that legal service providers representing low-income New Yorkers in housing court are facing astronomical caseloads, with up to 80 cases per attorney. Due to the volume of evictions, and despite New York City’s Right to Counsel law, most tenants facing new evictions in Manhattan, Brooklyn, Queens, and the Bronx right now do not have legal representation. In the week of February 5th, 2023 – the most recent data available from the Right to Counsel NYC Coalition – just 38 percent of tenants in eviction cases had legal representation. In January of 2022, that percentage was 67 percent. According to Princeton University’s Eviction Lab, since the beginning of the COVID-19 pandemic, 223,397 evictions were filed in New York City. Last week, landlords filed 1,415 new eviction cases.
Conclusion
The data we have presented today tells a clear story. The 2021 data that the Board relies on to evaluate landlord incomes and expenses paints a picture of losses driven by a very specific set of circumstances: the departure of high-income tenants from parts of the city, and the inability of large numbers of suddenly unemployed tenants to pay the rent. Since then, high-income tenants have returned and are paying higher rents than ever, and public programs have repaid landlords billions of dollars for rental arrears. Meanwhile, rent stabilized tenants continue to struggle to make ends meet in an increasingly expensive city.
The Rent Guidelines Board should not make rent stabilized tenants pay rents they can’t afford in order to repay landlords for old losses they’ve already recouped. We encourage the Rent Guidelines Board to reject calls for a rent increase of any kind.
Notes
1. The U.S. Census Bureau reviewed all of the 2021 NYCHVS estimates that appear in this report for unauthorized disclosure of confidential information and approved the disclosure avoidance practices applied to this release. CBDRB-FY22-199 and CBDRB-FY22-POP001-0101.