Mostly C’s: How New Yorkers Rate the Quality of New York City Public Schools
Jennifer Hinojosa

Key Findings
- In 2022, New Yorkers have a less positive perception of their local schools compared to the nation overall.
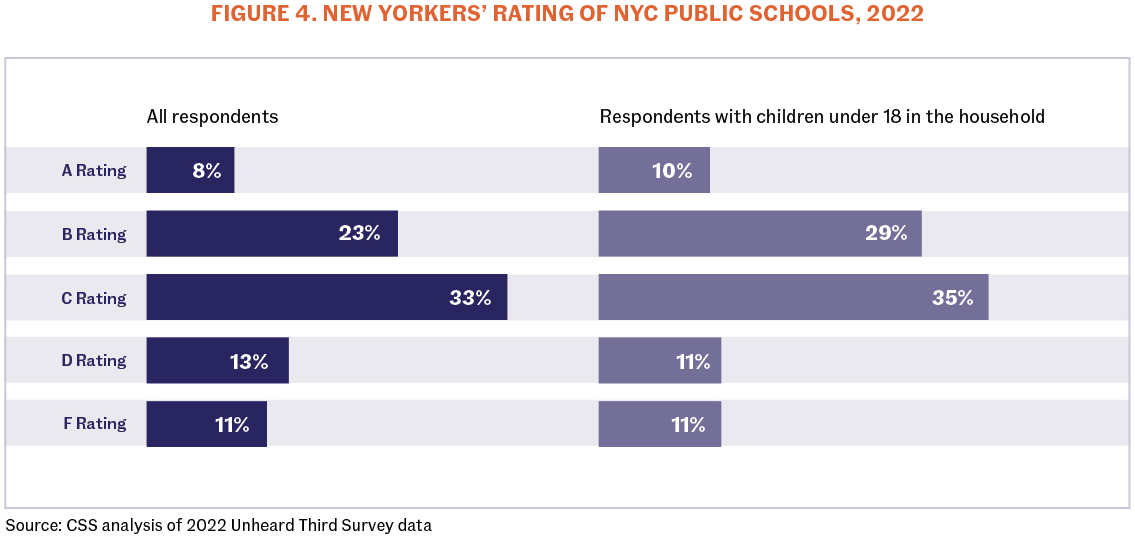
- About 33 percent of New Yorkers and 35 percent of New Yorkers with children gave New York City's public schools a C grade, or just fair, in our 2022 Unheard Third Survey.[1]
- Respondents with children under the age of 18 in their households rated New York City public schools higher, with more ratings of A’s (10 percent) and B’s (29 percent) than all New Yorkers (8 percent rated with A’s and 23 percent rated with B’s).
- White, higher-income New Yorkers with children in the Bronx (14 percent rated with A's) and Manhattan (38 percent rated with A’s and 39 percent rated with B’s) were more inclined to give positive (A and B) ratings to public schools in all five boroughs compared to other racial and ethnic groups.
- Unsatisfactory ratings (D/F’s) were the highest among Black respondents with children (28%) followed by Hispanic/Latinx (22%), and whites (20%) in 2022.
- Overall, respondents from Manhattan (50 percent) and Queens (42 percent) gave more positive (A and B) ratings compared to Brooklyn (37 percent) and the Bronx (30 percent).
- Overall, low-income New Yorkers with children (13 percent rated public schools with an A) gave higher public school ratings than moderate- to high-income New Yorkers with children (9 percent rated public schools with an A).
- Of note, since our last report on NYC public school ratings in 2011, satisfactory ratings overall have declined while unsatisfactory ratings increased among New Yorkers.
- White New Yorkers had a more favorable rating and were more likely to give A’s and B’s (52 percent), while a lower share of Black (26 percent) and Hispanic/Latinx (37 percent) respondents rated the same way in 2022.
Rating System of Public Schools
This report includes a summary of New York City’s public school ratings from survey respondents in our yearly public poll. Rating New York City’s public schools is part of our public opinion section. Our Unheard Third survey uses the common “A to F” letter grading system, with “A” signifying excellent and “F” meaning failure. This grading system was determined by CSS and our polling partner to be the most familiar to parents, educators, policymakers, and advocates in assessing school quality.
Question on Rating Public Schools in the Unheard Third Survey
The 2022 Unheard Third Survey posed the following question to New Yorkers:
- What grade would you give Public Schools in New York City overall for the job they are doing in Education? A for excellent, B, C, D, or F for fail?
Introduction
New York City public schools re-opened on September 7th for the 2022-2023 school year, following nearly three years of upheaval that began with the onset of the Covid-19 pandemic. School systems across the country faced the longest school closures in modern history due to the pandemic, which resulted in significant learning loss. Nationally, according to the 2022 results from the Nation’s Report Card, for fourth and eighth graders, the Covid-19 pandemic erased nearly two decades of student progress. In math, students saw the largest decline in scores since 1990, and in reading, scores plummeted to levels not seen since 1992.[2] Comparatively, New York’s losses in fourth grade math and reading average scale scores were double the national average and exceeded 45 other states in math and 38 other states in reading. New York’s fourth grade average math scores dropped 10 points, double any other decline in the past 20 years.[3]
Similarly disappointing, after a decade-long trend of rising educational attainment for young adults and their increasing gains in the labor market in New York City, the onset of the pandemic saw a reversal of those gains as well (Chatterjee, Torres & Hinojosa 2023).[4] According to the report, in absolute terms, an additional 25,500 16- to 24-year olds have joined the out-of-school, out-of-work category in New York City. These data points make clear that early academic learning losses will likely follow students throughout their academic life and into the labor market. And New York City public schools face yet another challenge: managing the unexpected influx of migrant students – approximately 20,000 – this academic year.[5] Taking into account these complex challenges, all relevant stakeholders—parents, educators, elected officials, policymakers, community support organizations, and school administrators—will need to play a significant role in ensuring the losses during the pandemic are mitigated and all students can still reach their greatest potential.
Our 2022 Unheard Third Survey provides insights into how New Yorkers across income, race/ethnicity, and borough rate the quality of their local New York City public schools. By analyzing public opinion questions on school quality, we can identify disparities in New York City public schools based on income, race/ethnicity, and geography.
NYC Public Schools SNAPSHOT
Student Enrollment vs. Racial/Ethnic Composition of NYC School Age Children
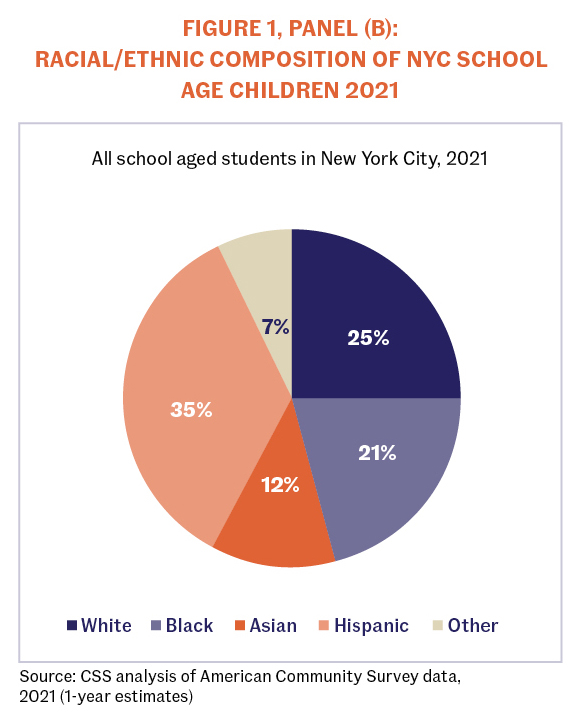
NYC public schools are currently under mayoral control and run by the New York City Department of Education (DOE)—the nation’s largest public school system. According to the DOE, there were over a million (1,058,888 by exact count) students enrolled in 1,859 schools within the NYC public school system.[6] At least 41 percent of the student body was Hispanic/Latinx, followed by 24 percent Black, 16 percent Asian, and 15 percent white in the 2022 school year (see Figure 1, panel (a)). This presents a contrast to the demographic composition of school-age children (aged 5 to 18 years) by race/ethnicity in New York City. For example, the school-age population in New York City was 31 percent Hispanic/Latinx, followed by whites (25 percent), Blacks (21 percent), and Asians (12 percent). In other words, there is a greater share of Hispanic/Latinx students enrolled in the city’s public schools than there is in the city’s population. The reverse is true for whites, whose share in the school system is 10 percentage points lower than their share in the general population, indicating that many white New Yorkers are opting to educate their children in private schools or at other non-DOE institutions.

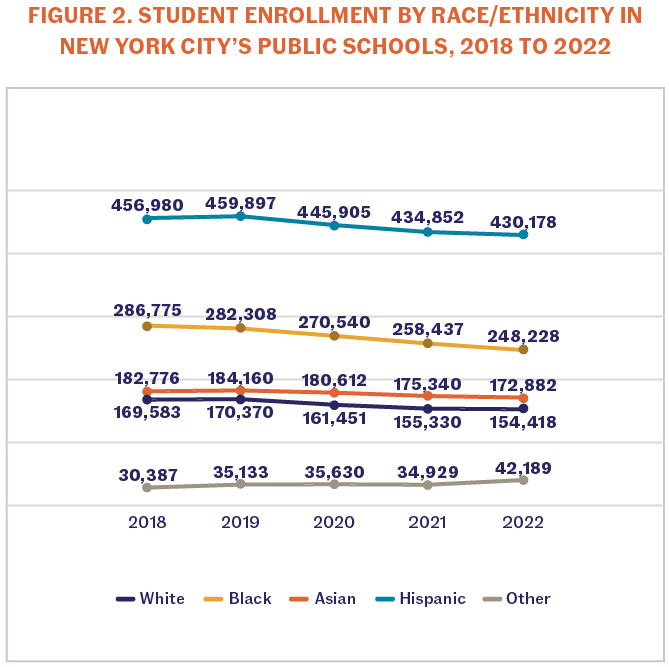
As shown in Figure 2, there was a decline of 78,606 in student enrollment, from 1.1 million in 2018 to 1 million in 2022. Across all groups, Black student enrollment experienced the steepest decline in absolute numbers, with a loss of 38,547 in a five-year period. This is followed by Hispanic/Latinx students, among whom enrollment declined by 26,802, whites (a decline of 15,165 enrollees), and Asians (a decline of 9,894 enrollees) in the same period. The decline in the number of Black students enrolled in the city’s schools reflects the overall decline in the Black population in New York City over the past two decades.[7] As shown in Figure 2, the decline of Black and Hispanic/Latinx student enrollment in NYC public schools could exacerbate existing challenges in providing quality education in the coming years.
How does student enrollment affect the Fair Student Formula (FSF) and why is it important?
Student enrollment greatly impacts a school’s budget. According to the NYC Department of Education, the Fair Student Funding Formula (FSF) is the main source of money for most NYC schools, and is based on the number of students enrolled at each school and the needs of those students (i.e. education needs of students with disabilities and English Language Learners).[8] Funding from FSF makes up about two-thirds of NYC public school budgets.[9] Under the FSF, schools with declining student enrollment may face budget cuts, while those with unchanged or higher enrollment may receive the same or an increase in their budget allocations. According to an analysis by Class Size Matters, schools with larger proportions of students who are Black and Hispanic/Latinx, Native American, low income, and students with disabilities are more likely to experience cuts to their FSF allocations.[10]
Eleven years ago, the Community Survey Society of New York released a report of How New Yorkers Grade the Public Schools Before and After Mayoral Control, which found an overall improvement of school quality among New Yorkers under Mayor Bloomberg’s administration.[11] The 2011 Unheard Third Survey was conducted from July 5th to July 31st, during the tenure of Mayor Bloomberg. In 2002, Mayor Bloomberg gained mayoral control over New York City's school system, enabling him to appoint the city’s schools chancellor and most members of the Panel for Educational Policy, altering the DOE's legacy. Under his mayoral tenure, Cathleen P. Black served three months as Chancellor of New York City's Department of Education before resigning on April 7, 2011. Mayor Bloomberg announced Dennis M. Walcott as her replacement.[12] Some of the notable education policies implemented under Mayor Bloomberg include increasing the charter school cap in 2007 and 2010,[13] creating more career and technical-focused schools, and establishing an academy to train school principals. He also enforced the use of FSF for budget allocation and implemented the Common Core State Standards in all NYC public schools. His policies also led to the closure of underperforming schools and disparities in funding allocation for schools with higher proportions of Black, Hispanic/Latinx, Native American, low-income, and disabled students.[14]
At the time of this survey, Mayor Eric Adams was in his second year in office and David Banks was the Chancellor of New York City's school system. The 2022 Unheard Third Survey took place two years after the pandemic, during a time when the city was still in the midst of a massive recovery, much of which continues today. Mayor Adams faced criticism over school enrollment declines, DOE budget cuts, and an increase in student chronic absences.[15] Other education policy changes that drew criticism included phasing out Mayor Bill de Blasio's 3-K for All program,[16] reinstating the 'gifted and talented' program in schools,[17] and launching the Summer Learning and Enrichment Program for K-8 youth.[18] Other positive education initiatives include increasing the 14- to 24-year-old enrollment in the Summer Youth Employment Program (SYEP)[19] and other initiatives to increase literacy[20] throughout New York City public schools. It is important to note that the DOE's budget was also supplemented by federal stimulus funding, which expected to run out by school year 2024-2025.[21]
NYC's School Budget
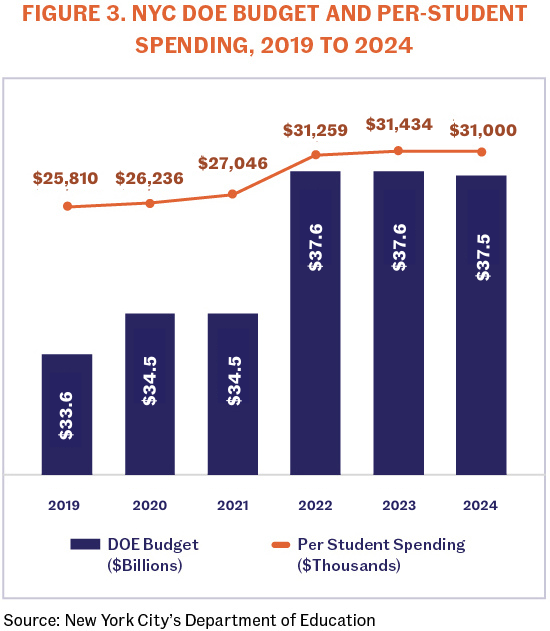
Figure 3 shows New York City’s DOE budget and per-student spending for the years 2019 to 2024. The DOE budget increased from $33.6 billion in 2019 to $37.6 billion in 2022, before declining slightly to $37.5 billion in 2024.[22] Per-student spending also increased from $30,703 in 2019 to $37,136 in 2022, which is likely due to the pandemic’s federal stimulus funding. The data suggests that the DOE budget has been increasing in recent years, which may have positive implications for the education system in New York City. However, the decline in budget allocation in 2023 and 2024 may pose challenges in maintaining this positive trend, which could have negative outcomes for Black, Hispanic/Latinx, and low-income students and lead to higher out-of-school, out-of-work youth populations and further decrease the quality of NYC public schools. And to be fair, increasing budget allocations for public schools does not always mean positive outcomes for students.
Public School Ratings by Nation vs. NYC
According to the 2022 PDK Poll of the Public’s Attitudes Toward the Public Schools, 54 percent of the nation’s adults rated their local public schools with A or B, while the remaining 45 percent gave a C, D, or F. Using the same breakdown, the 2022 Unheard Third Survey revealed that only 31 percent of New Yorkers gave an A or B rating to their local NYC public schools, and the remaining 57 percent rated them a C, D, or F. These results show that public perceptions of public schools in New York City differ significantly from the national average.
At least 9 percent of New Yorkers with children rated NYC public schools with an A, followed by 29 percent with a B, 35 percent with a C, 11 percent with a D, and the remaining 11 percent with an F in 2011. Since then, our 2022 Unheard Third Survey found positive ratings (A/B) declined while unsatisfactory ratings (D/F) increased (see figure 4).
Public School Ratings Citywide vs. New Yorkers with Children
According to the 2022 Unheard Third Survey, respondents with children under 18 in the household viewed the city’s public schools slightly more favorably when compared to the general respondent pool (see figure 4) but 57 percent of respondents in both groups rated the public schools as “C” or worse.
Specifically, 10 percent of respondents with school age children rated New York City public schools with an “A” while 8 percent of all respondents gave a similar rating. Almost a third of respondents with children (29 percent) gave a “B” rating relative to all respondents (23 percent). Both groups—households with children as well as the general public—had similar shares of respondents who rated the schools as “C” or below.
Education Next a national poll of public opinion on education found similar results of parents of school-going children are more likely to give higher and positive ratings relative to the general population in their communities.[23] According to this survey, parents with children tend to have positive opinions on places/things they are most familiar with, in this case their local public schools.[24]
Public School Ratings by Income
As shown in Figure 5, 13 percent of low-income New Yorkers with children rated their schools as best performing–about 4 percentage points higher than the share of moderate-to-high income New Yorkers who rated their schools as A. Moderate- to high-income New Yorkers (31 percent) gave more B ratings compared to low-income New Yorkers (25 percent); while both low-income (33 percent) and moderate- to high-income New Yorkers (36 percent) rated their public schools as C. Unsatisfactory ratings like D were higher among low-income New Yorkers (13 percent), while 9 percent of moderate- to high-income New Yorkers had similar ratings. Lastly, about 13 percent of moderate- to high-income New Yorkers rated NYC public schools with an F, which was at least 6 percentage points higher than low-income New Yorkers (7 percent).
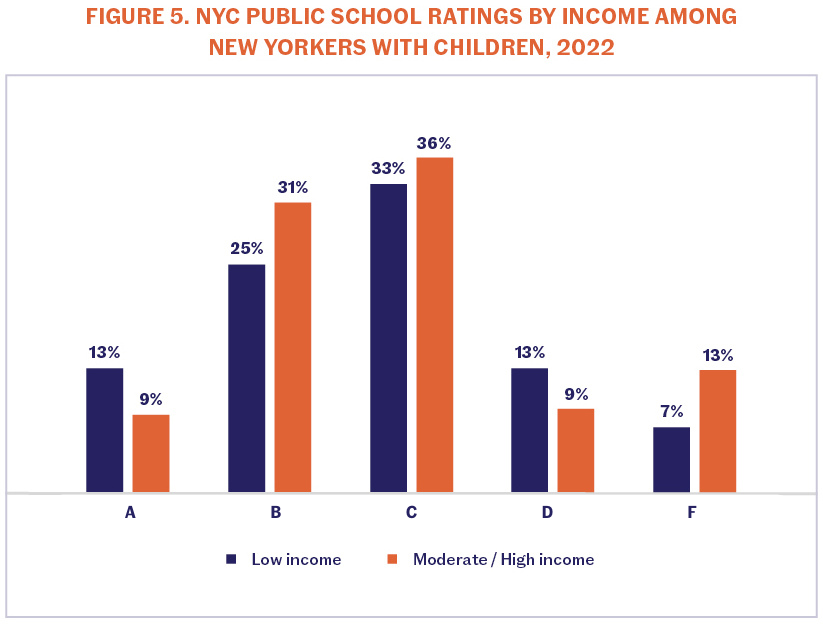
Figure 6 compares 2011 and 2022 results. As shown in Figure 6, the percentage of A/B ratings among New Yorkers with children decreased across all income levels, except for moderate-income New Yorkers. Low-income New Yorkers’ ‘satisfactory’ or A/B ratings declined from 47 percent in 2011 to 40 percent 2022, while near-poor New Yorkers and high-income New Yorkers showed a decline of 2 percentage points. As observed in this report, C ratings remained consistent between 2011 and 2022, however, poor New Yorkers with children showed a slight increase from 27 percent to 30 percent. The percentage of D/F ratings increased the highest among high-income New Yorkers, from 13 percent in 2011 to 23 percent in 2022, and then among near-poor New Yorkers, from 17 percent to 20 percent. Among poor and moderate-income New Yorkers there was a slight decline of ‘unsatisfactory’ ratings (D/F’s).

Public School Ratings by Race/Ethnicity
As depicted in Figure 7, white respondents were more likely to give A’s and B’s (52 percent), while a lower share of Blacks (26 percent) and Hispanic/Latinx (37 percent) respondents rated the same way in 2022. All groups showed comparable rates of rating public schools with C. Unsatisfactory ratings (D/F’s) were the highest among Black respondents (28 percent) followed by Hispanic/Latinx (22 percent), and whites (20 percent) in 2022. According to a recent study by Angrist et al. (2022), white students were more likely to be enrolled in higher-rated public schools than their Black and Hispanic/Latinx peers and observed a strong correlation between higher rated schools and the probability of having a greater percentage of white students (Angrist, Hull, Pathak, and Walters 2022).[26]
Comparing public school quality ratings by race/ethnicity from our 2011 CSS report, the percentage of white respondents with children who gave A/B grades increased by 12 percentage points (from 40 percent to 52 percent), while Hispanic/Latinx declined by 7 percentage points (from 44 percent to 37 percent), and among Black respondents by 4 percentage points (from 30 percent to 26 percent) between 2011 and 2022.
On the other hand, unsatisfactory grades (D/F) increased for Black respondents from 12 percent in 2011 to 20 percent in 2022. Similarly, the number of Hispanic/Latinx respondents who rated NYC public schools with D’s/F’s increased from 18 percent to 22 percent.
These findings suggest, overall, white respondents were more positive and satisfied about the quality of their public schools, while Black and Hispanic/Latinx respondents did not have the same perception.

Public School Ratings by Borough
Echoing the observations made at the citywide level, almost a third of all respondents across the five boroughs gave the public school system a C grade in 2011 and 2022. Figure 8 compares quality of public school in 2011 and 2022 among parents with children in the household. The data reveals that in 2022, the percentage of New Yorkers with children who gave a grade of A/B decreased in the Bronx and Brooklyn, while it slightly increased in Manhattan and Queens. Conversely, the percentage who gave C grades increased in the Bronx and Queens, while it decreased in Brooklyn and Manhattan. The percentage of New Yorkers with children who gave D/F grades increased in the Bronx from 23 percent to 29 percent, Manhattan from 10 percent to 16 percent, and Brooklyn from 21 percent to 26 percent. On the other hand, D/F’s declined in Queens from 28 percent to 16 percent.
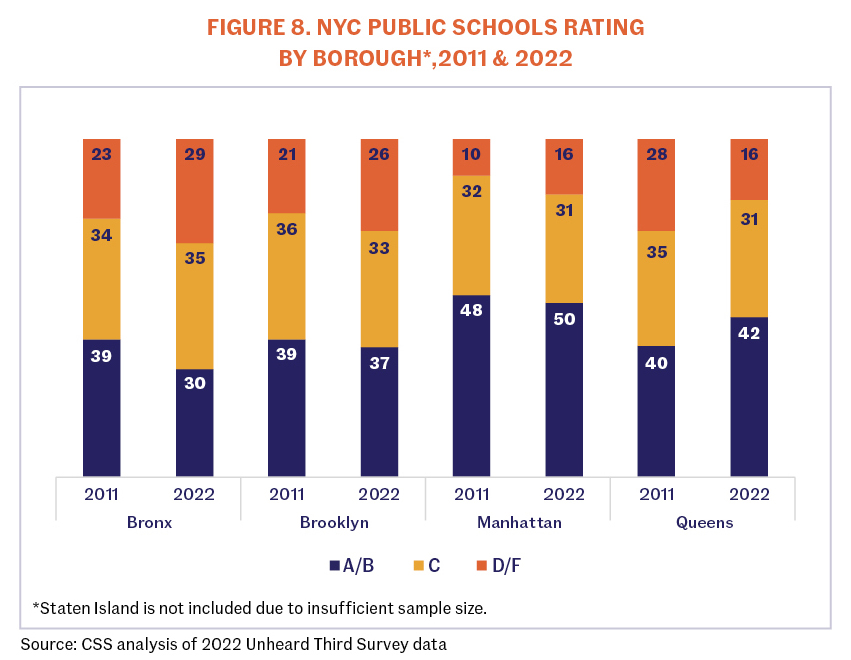
In addition, we should note here that among respondents with children in Manhattan, 21 percent rated the schools as A (excellent). An additional 31 percent rated the schools at a B level. For all other boroughs, there was no qualitative difference between the ratings of the general population and of those who had children in their households.
Taking into account the observations from ratings by race/ethnicity and by boroughs, it is clear that the public school ratings reflect the segregated nature of New York City’s population. White New Yorkers, who tend to be more affluent, reside in high-performing school districts, especially in Manhattan, the Bronx and Brooklyn, while Black and Hispanic/Latinx New Yorkers rate the public school system as under-performing across the five boroughs.
Conclusion and Policy Implications
It is not surprising that most New Yorkers continue to rate New York City schools as just fair (C), but since our last 2011 report on this same subject, we have seen a decline in satisfactory ratings and an uptick in unsatisfactory ratings among New Yorkers, and we expect that this is likely related to worsening education conditions across the board during the pandemic. As shown in this report, New York City’s Black and Hispanic/Latinx populations are more likely to be unsatisfied with NYC public schools compared to the white population.
As students gear up for what many of us hope will be a full year of uninterrupted and productive schooling, there are still many unknowns, and understandably, much concern about the current and future achievement of our students. A 2022 CSS report “Disconnected: The Digital Divide & Disrupted Schooling in NYC”, New York City parents, irrespective of their income, were highly concerned about their children's educational prospects due to the pandemic (Joseph and Lew 2022).[27] Student learning, particularly among Black and Hispanic/Latinx students, was deeply impacted by COVID’s disruption. The result has been significant learning loss for millions of young people, and schools today face a unique set of challenges as they seek to recover what has been lost. For example, Districts 7 and 9 in the South and West Bronx had the lowest test results in both math and English proficiency in 2022.[28] As Chancellor David Banks stated, New York City alone is facing a literacy crisis as 51 percent of students overall are not reading on their grade level, with 64 percent of black and 63 percent of Hispanic/Latinx students not reading on their grade level.[29] School districts will likely continue to face difficulties with respect to budgeting and funding due to reduced enrollments, staffing challenges, and the unique challenge of an influx of migrant students to accommodate.
Providing high-quality education to all children, regardless of their household income, race/ethnicity, household type, or zip code can provide social mobility and gains in the labor market. It is estimated that NYC’s DOE allocated $37.5 billion for the 2023-2024 school year, a reduction of $100 million from 2022-2023 of $37.6 billion.[30] Our analysis shows that a large proportion of unsatisfactory ratings (D/Fs) were the highest among Black respondents with children (28 percent) and Hispanic/Latinx (22 percent). Historically, underperforming NYC public schools with larger proportions of black and Hispanic/Latinx enrollment, low income, and students with disabilities are at the forefront.
We believe the city should consider providing a more equitable distribution of funding and resources, specifically targeted towards improving under-performing schools, especially in areas of areas of high poverty, and in areas with a high out-of-school and out-of-work youth population. Typically, as enrollment declines in schools, so follow budget cuts for those same schools. It will be critical for the City of New York to resist the urge to cut school budgets based solely on this factor; especially for schools that are underperforming and in areas that are majority Black and Hispanic/Latinx, as resources for these particular populations are already scarce. Secondly, the city should prioritize creating opportunities for economic mobility and pathways to prosperity for historically marginalized communities, especially in areas with the highest school budget cuts, absentee rates, dropout rates, and out-of-school-and out of work youth population.[31]
About the Unheard Third Survey
The 2022 Unheard Third is a scientific telephone survey of 1,968 New York City adult residents reached by cell phones and landlines from July 12th through August 18th, 2022. It was designed by Community Service Society in collaboration with Lake Research Partners, who administered it using Random Digit Dialing and professional interviewers. The sample included 1,234 low-income residents (up to 200 percent of federal poverty standards, or FPL), and 734 moderate and higher-income residents (above 200 percent FPL). Interviews were conducted in English, Spanish, and Chinese. The margin of error for the entire survey is +/- 2.2 percent, for the low-income component is +/- 2.8 percent, and for the higher-income component is +/- 3.6 percent, all at the 95 percent confidence interval. For further information on the survey please reach out to Emerita Torres at etorres@cssny.org.
Notes
- The 2022 Unheard Third is a scientific telephone survey of 1,968 New York City adult residents reached by cell phones and landlines from July 12th through August 18th, 2022. It was designed by Community Service Society in collaboration with Lake Research Partners, who administered it using Random Digit Dialing and professional interviewers. The sample included 1,234 low-income residents (up to 200 percent of federal poverty standards, or FPL), and 734 moderate and higher-income residents (above 200 percent FPL). Interviews were conducted in English, Spanish, and Chinese. The margin of error for the entire survey is +/- 2.2 percent, for the low-income component is +/- 2.8 percent, and for the higher-income component is +/- 3.6 percent, all at the 95 percent confidence interval. For further information on the survey please reach out to Emerita Torres at etorres@cssny.org
- The Nation’s Report Card. NAEP Long-Trend Assessment Results: Reading and Mathematics
- The Nation’s Report Card. NAEP Long-Trend Assessment Results: Reading and Mathematics
- Chatterjee, Hinojosa, and Torres. (2023) Reversing Nearly a Decade of Positive Trends. JobsFirstNYC and Community Service Society of New York.
- Gould, Jessica. (2023, September 7) Thousands of Migrant Students Head to School in NYC for the 1st time. From Thousands of migrant students head to school in NYC for 1st time - Gothamist
- NYC Department of Education: DOE Data at a Glance
- Closson, Troy and Hong, Nicole. (2023, February 3) Why Black Families are Leaving New York, and what it Means for the City
- NYC Department of Education: Funding Our Schools
- NYC Department of Education: School Budgets SY 2023-2024 (January-March 2023) PPT;
- Class Size Matters. Analysis of NYC School Budget Cuts; Updated; June 29, 2023.
- Rankin, Nancy. (2011) How New Yorkers Grade the Public Schools Before and After Mayoral Control. Community Service Society. How New Yorkers Grade the Public Schools Before and After Mayoral Control
- Santos, Fernanda. (2011. April 8) Schools’ New Emissary, From City Hall. From Man in the News: Dennis M. Walcott, N.Y.C. Chancellor - The New York Times (nytimes.com)
- Haimson, Leonie. (2013, February 25). Micheal Bloomberg’s Disastrous Public Education Legacy.
- Barnum, Matt. (2020, February 26) A Quick Study on Mike Bloomberg’s Education Record as Mayor. From A Quick Study on Mike Bloomberg’s Education Record as Mayor - THE CITY
- Zimmerman, Alex. (2022, September 16) 41% of NYC Students were Chronically Absent last school year.
- Fitzsimmons, Emma G. (2022, September 22) 3-K for all? Adams Retreats from Expanding N.Y.C. Preschool Program.
- Zimmerman, Alex. (2023, April 28) Enrollment at NYC’s transfer high schools tanked during the pandemic. Can it rebound?
- NYC Office of the Mayor. (2022, March 11) Mayor Adams Announces Summer Learning and Enrichment Program for K-8 Youth.
- NYC.Gov (2022, February 15). New York City Mayor Eric Adams Announces Record 100,000 Summer Youth Employment Opportunities.
- NYC.Gov (2023, May 9). Mayor Adams and Chancellor Banks Launch Major new Citywide Campaign to Dramatically Strengthen Literacy.
- NYC Mayor’s Office of Management and Budget: COVID 19 Funding Tracker. (2022, February).
- NYC Department of Education: Funding Our Schools
- Barnum, Matt. (2023, July 25) Politicians and pundits say parents are furious with schools. Polls say otherwise. From COVID and school closures may not have triggered parents’ anger, polls say - Chalkbeat
- Kamenetz, Anya. (2016, August 23) Americans like their Schools Just Fine- But Not Yours. From Americans Are Concerned About Direction Of Public Education, Two New Polls Show : NPR Ed : NPR
- The ratings range from A/B (highest) to D/F (lowest).
- Angrist, J., Hull, P., Pathak, P.A., and Walters, C.R. (2022): “Race and the Mismeasure of School Quality,” MIT Blueprint Labs Discussion Paper #2022.01.
- Joseph, Patrick and Irene Lew. (2022): “Disconnected: The Digital Divide & Disrupted Schooling in NYC. Community Service Society of New York. Disconnected: The Digital Divide & Disrupted Schooling in NYC | Community Service Society of New York (cssny.org).
- Krauth, Dan. (2022, November 21). Pandemic Learning Loss hits New York City minority students hardest.
- Jones, David R. (2023, September 14). URBAN AGENDA: A Conversation with NYC Schools Chancellor David Banks.
- NYC Department of Education: Funding Our Schools
- Chatterjee, Hinojosa, and Torres (2023). Reversing Nearly a Decade of Positive Trends. JobsFirstNYC and Community Service Society of New York.