Examining West Harlem: Demographic and Economic Changes
Summary
In the years since Columbia’s West Harlem expansion was approved, West Harlem has seen extensive and intensive changes to its demographic makeup, notably significant changes in race and ethnicity, and income. Alongside these demographic changes, rents and sales prices have risen, rent stabilized housing has been lost, and evictions have been ongoing. In this brief memo, we will examine some of those changes at the neighborhood level.
Key Findings:
- Between 2010 and 2020, Community District 9’s Black population declined by 14 percent (3,800 residents) and its Hispanic population declined by 10 percent (4,500 residents).
- In 2010, almost half of the households in M09 had household incomes below $50,000 and only 8 percent had incomes above $200,000. By 2021, the share of households with incomes below $50,000 has declined by 10 percentage points to 38 percent and the share of households at the top with incomes above $200,000 has more than doubled to 19 percent.
- Between 2010 and 2020, the district lost 2,000 families, which included 4,060 children.
- The share of Community District 9’s private rental housing stock that is rent regulated slipped from approximately 65 percent in 2008 (22,500 units) to approximately 48 percent in 2022 (16,700 units), a loss of nearly 6,000 regulated rentals.
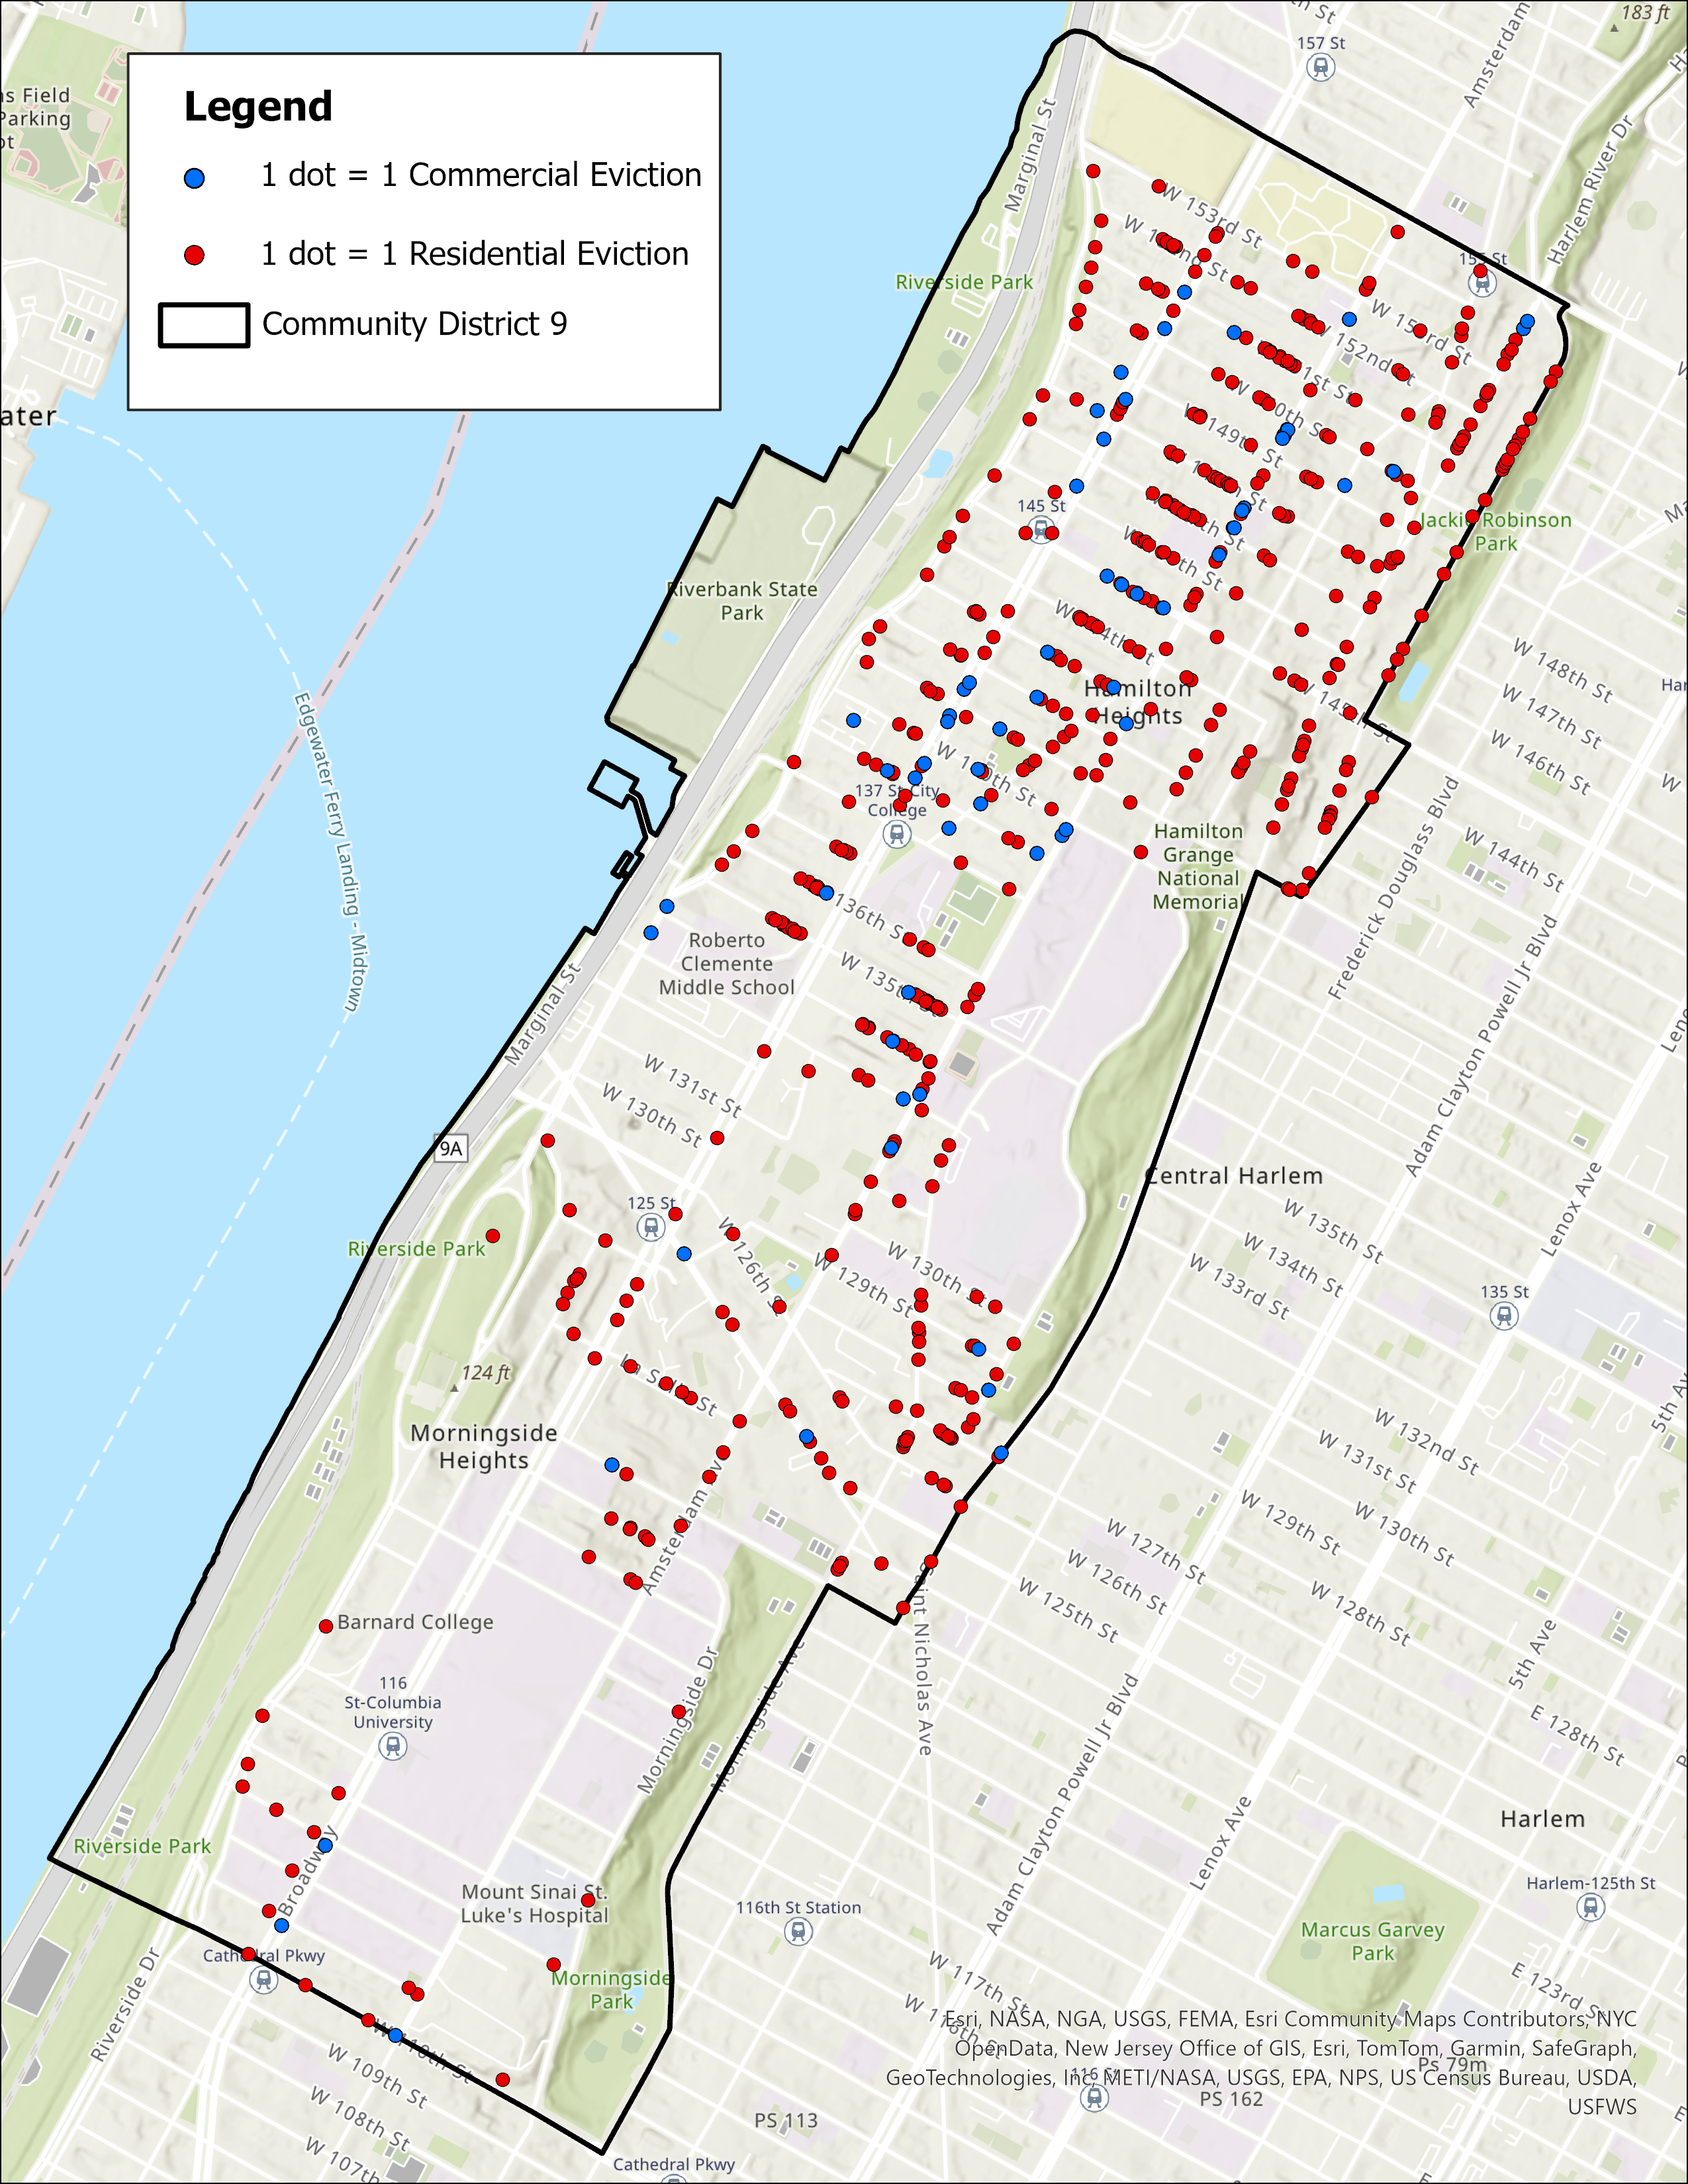
- Over 1,000 residential and commercial evictions were carried out in Community District 9 since 2017 (the earliest year such data is available).
- Just 13 percent of Columbia University’s expansion spending had gone to neighborhood-based companies.
Methodology
Methodology: For the purposes of this analysis, we looked for public data on demographic and market trends in Manhattan's Community District 9 (M09) from around the years immediately following Empire State Economic Development’s approval of Columbia’s General Project Plan (December 2008) to the present. We relied on a number of data sources, including: the Decennial Censuses from 2010 and 2020; American Community Survey 5-year estimates from 2010 and 2021; eviction data from New York City Department of Investigation; and district-level housing profiles compiled by The Furman Center. We also cite journalistic accounts from sources like the Columbia spectator. We selected Community District 9 (MN09) as the study area as it contains Columbia's Manhattanville Project as well as the most impacted surrounding communities. MN09’s boundaries are: West 110th street to West 155th street, between the Hudson River and Manhattan, Morningside, St Nicholas, Bradhurst and Edgecombe Avenues.
Race and Ethnicity: Significant decline in Black and Hispanic residents
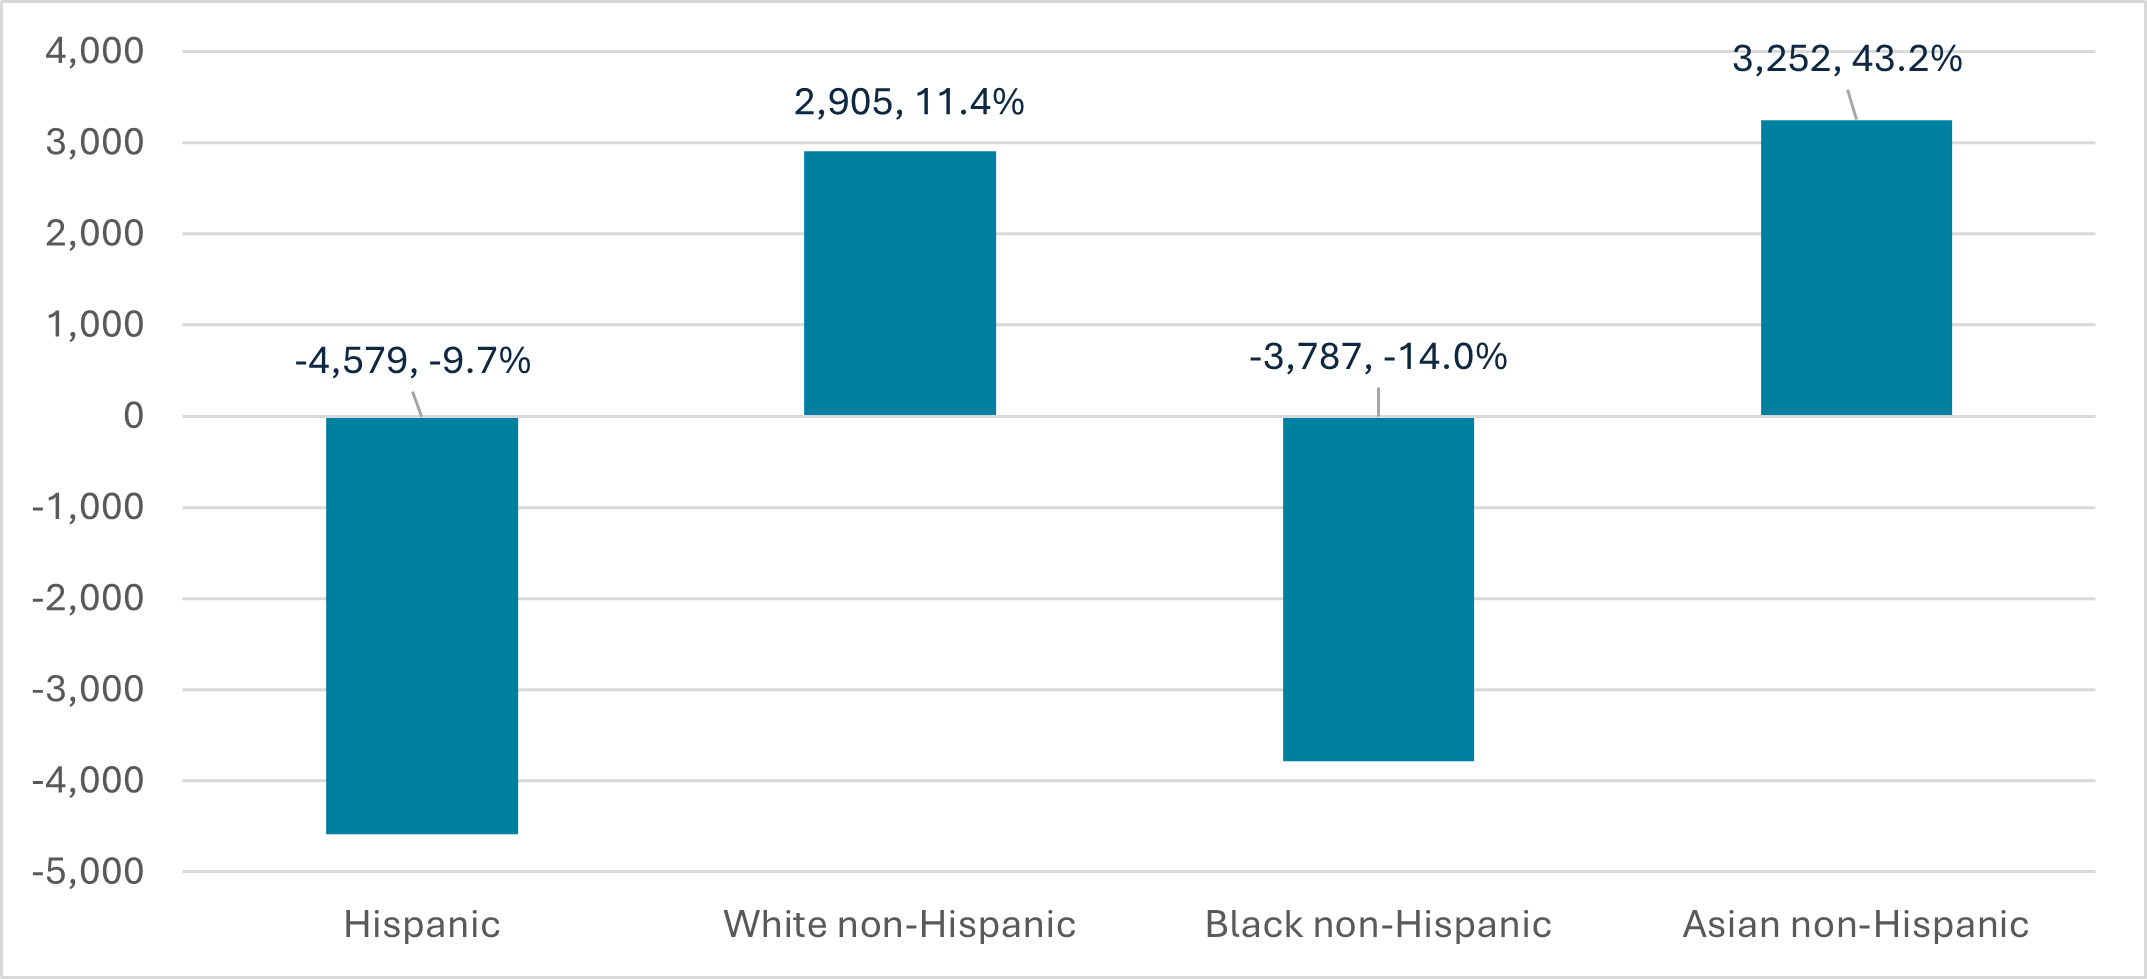
Manhattan Community District 9 (abbreviated to M09) is home to over 110,000 individuals. In the years between the 2010 and 2020 censuses, the district’s Black population declined by 14 percent (3,800 residents) and its Hispanic population declined by 10 percent (4,500 residents). Meanwhile, over 6,000 Asian and White New Yorkers moved into the district.
Figure 1: Change in M09 population by race/ethnicity, count and percentage, 2010 and 2020
Income and Household Composition: Increasing inequality, as low-income Black and Hispanic households are displaced, and wealthier White and Asian families move in
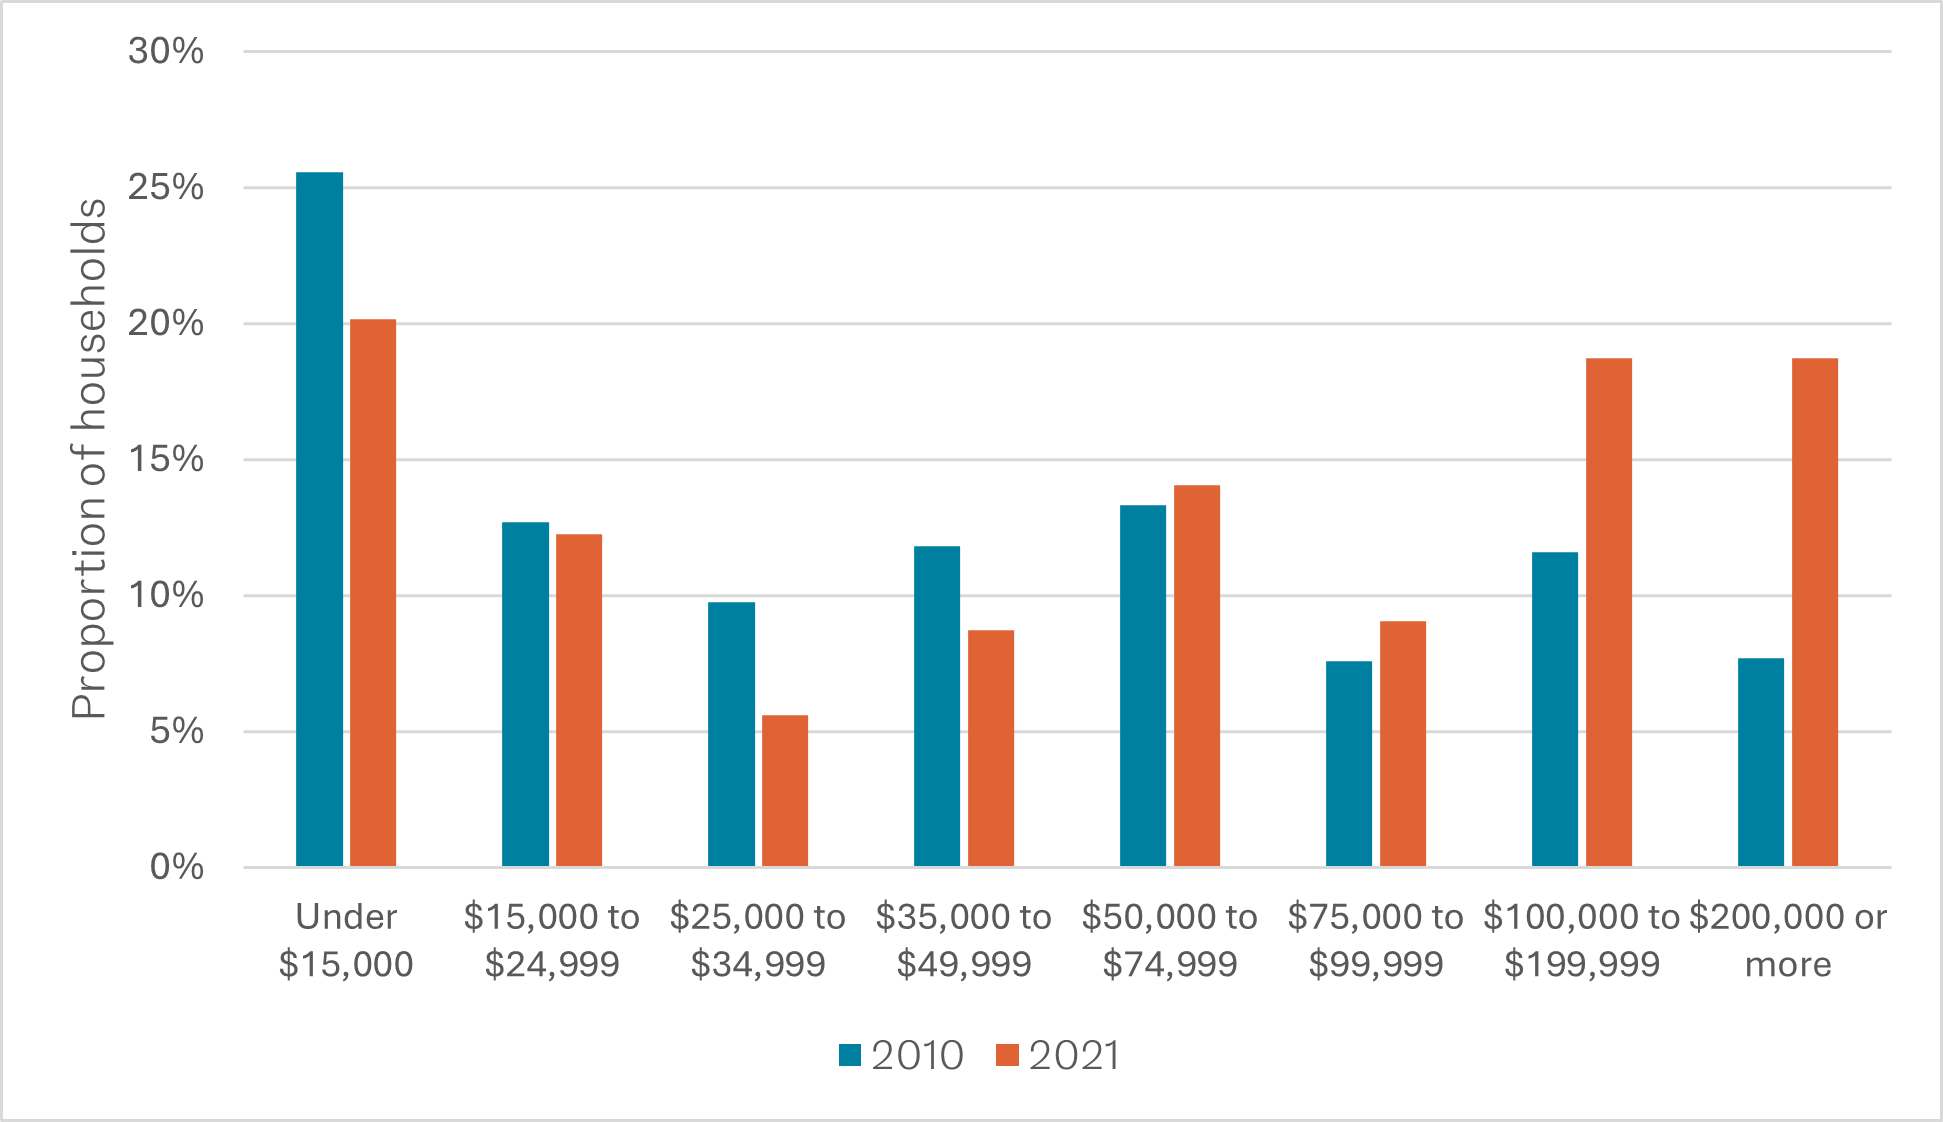
The distribution of household income has also become more unequal over the last decade. In 2010, almost half of the households in M09 had household incomes below $50,000 and only 8 percent had incomes above $200,000. By 2021, the share of households with incomes below $50,000 has declined by 10 percentage points to 38 percent and the share of households at the top with incomes above $200,000 has more than doubled to 19 percent. This indicates a profound shift in the composition of households in the area: as lower income Black, Hispanic and young families have been displaced, higher income White and Asian households have moved in. While this pattern can be found in many parts of Manhattan, the divergence in incomes in M09 has been greater than for the borough as a whole.
Figure 2: Distribution of M09 household income, 2010 and 2021
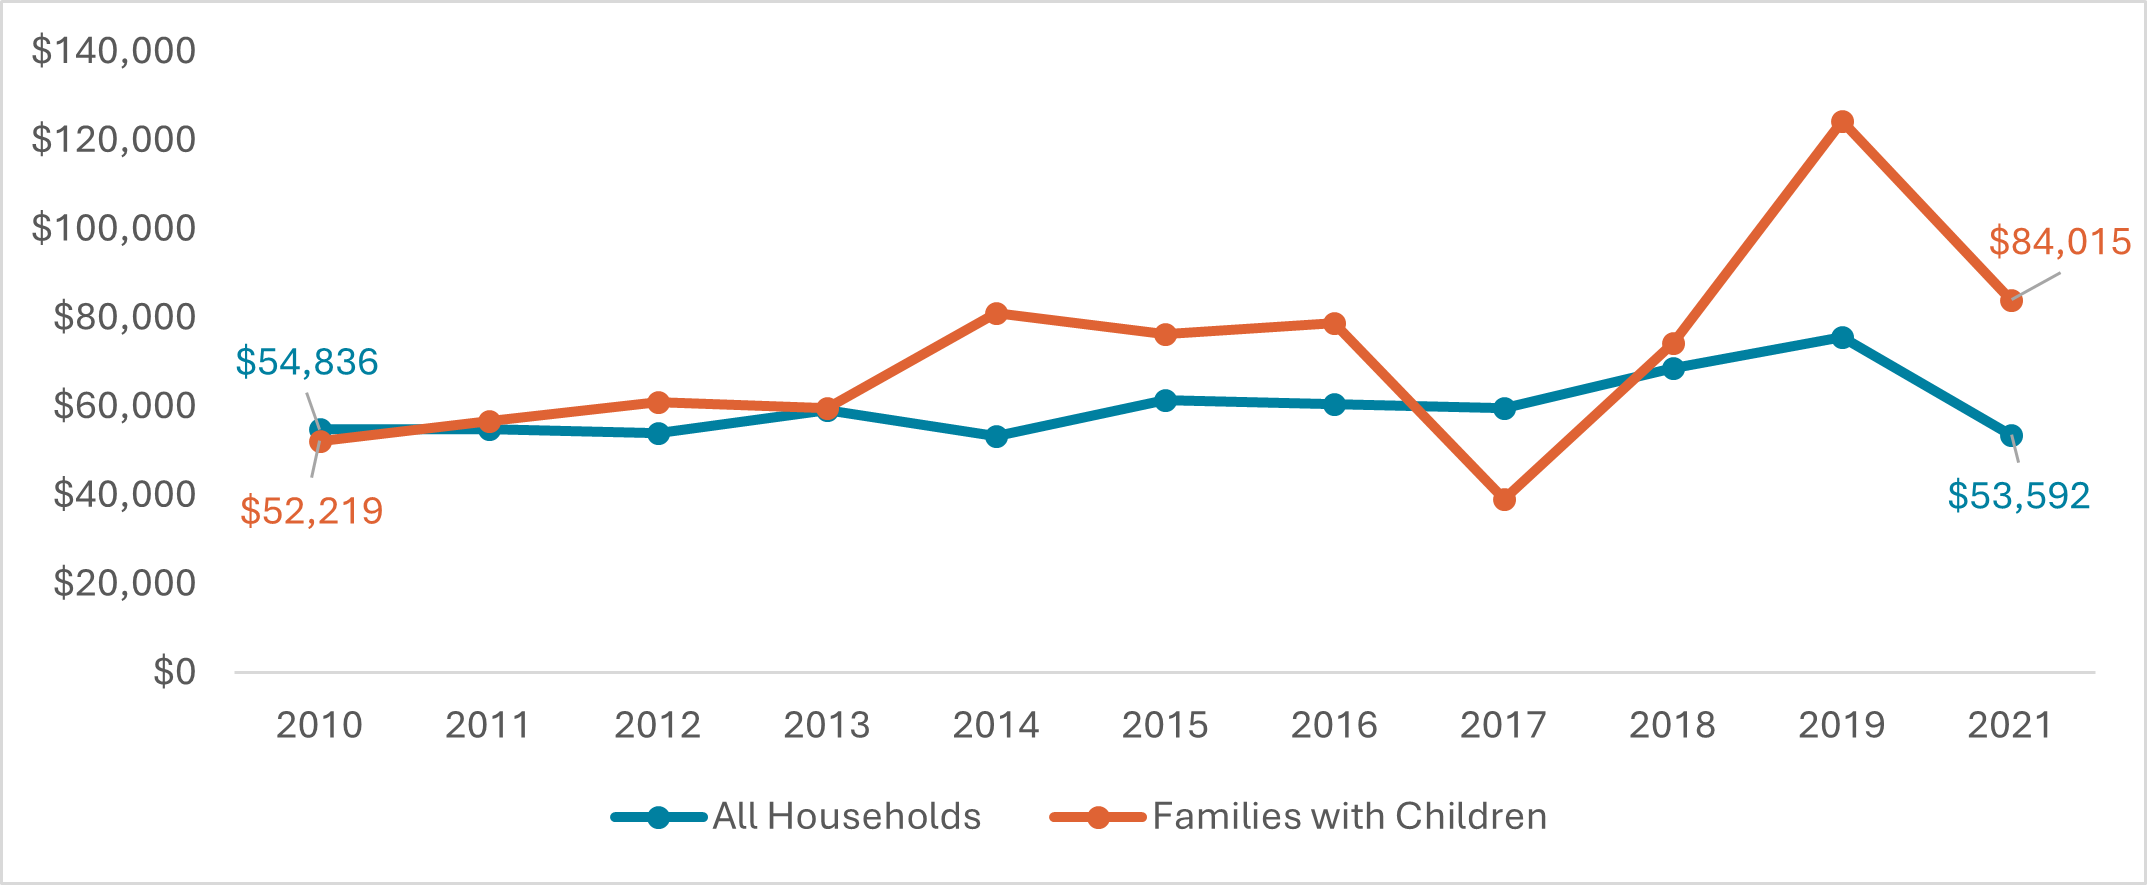
Overall, household incomes in the district have declined slightly when adjusted for inflation. But for families with children, the median income leaped by an extraordinary 61 percent—from $43,068 in 2010 (equal to $52,218 in 2021 dollars) to $84,015 in 2021.
Figure 3: Median incomes for all M09 households and for families with children, 2010-2021 (inflation adjusted to reflect 2021 dollars)
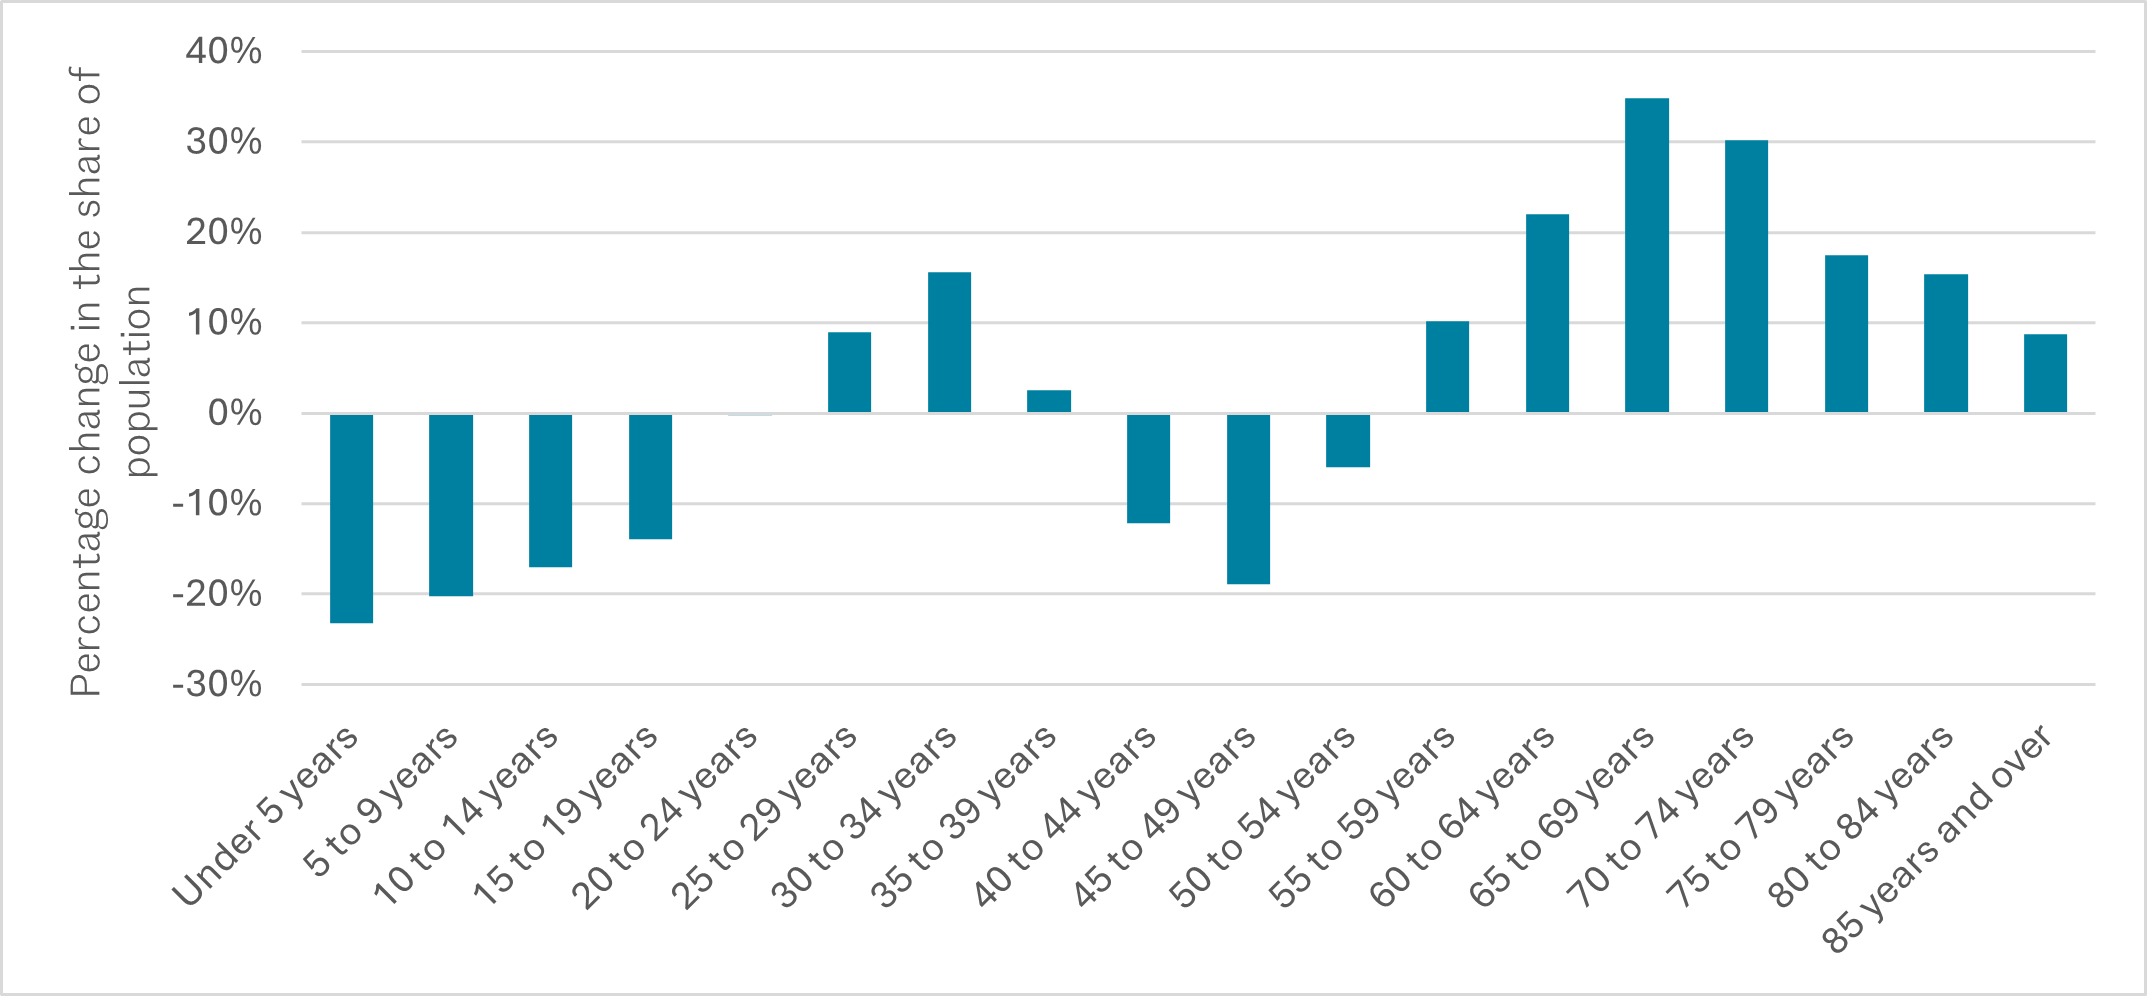
The share of families with children in the district, though richer, is also smaller than it was in 2010. Between 2010 and 2020, the district lost 2,000 families, which included 4,060 children. The new families that have arrived, however, tend to have significantly higher incomes than those who preceded them.
Figure 4: Change in distribution of population across age groups. 2010 and 2020
Housing and Rents: Shrinking Stock, Deregulated Units, and Rising Rents and Sales Prices
According to data from the Furman Center, from 2006 to 2022 the supply of housing in Community District 9 declined by 9 percent (4,862 units), even as the city’s overall housing stock grew by 9 percent (308,416 units). One reason for this decline is that Columbia bought out and emptied at least two residential buildings in the neighborhood (602 West 132nd Street and 3289 Broadway). According to reporting in the Columbia Spectator, Columbia paid residents $7,000 for relocation costs and $2,000 for moving expenses. In 2016, that relocation fee would have covered just two months of median asking rents in West Harlem.
Meanwhile, what housing has been added is largely for homeownership, rather than for rent. While homeownership can bring a great deal of stability to neighborhood households, average sales prices are far from affordable to most neighborhood renters. The median condominium sales price (adjusted for inflation) has increased by 25 percent since 2006, from an already exorbitant $776,540 to $970,000.
Among rentals, the share of Community District 9’s private housing stock that is rent regulated slipped from approximately 65 percent in 2008 (22,500 units) to approximately 48 percent in 2022 (16,700 units), a loss of nearly 6,000 regulated rentals. At the same time, median gross rent (adjusted for inflation) rose 19 percent between 2008 and 2022. The share of households paying between $2,000 and $2,500 more than doubled from 9 percent of renters to 24 percent, while the share of households paying between $1,000 and $1,500 declined from 29 percent of renters to 10 percent of renters. During the same period, the share of renters who pay more than $4,000 a month increased three times. (Furman Center).
Residential and Commercial Evictions: Over a thousand evictions throughout West Harlem
Unfortunately, reliable eviction data is only available for the past few years, rather than from the beginning of Columbia’s expansion. According to the New York City Department of Investigations, 997 residential evictions and 71 commercial evictions were carried out in Community District 9 since 2017. While executed evictions were relatively scarce on the south end of the district, they were more common closer to the Columbia University expansion area, with the greatest concentration in the northern end of MN09.
Local Economic Development: Promises made, not always kept
Although Columbia University promised in their Community Benefits Agreement to hire locally-owned firms, an analysis by the Columbia Spectator found that just 13 percent of expansion spending had gone to neighborhood-based companies. This accounts for just $153 million out of $1.2 billion in construction costs. The total amount Columbia has promised to spend or donate to West Harlem community interests over 36 years is equivalent to the amount the university saves in taxes each year due to its nonprofit status ($170 million). As of last year, Columbia had completed just six of its 39 Community Benefit Agreement promises. Twenty-six others are in progress at some stage, but seven others have yet to begin being fulfilled.